Installation with Monitoring
For monitoring setup, you’ll need to add themetricsApiKey and prometheus.enabled=true to the values.yaml file.
Access Grafana
LangWatch includes integrated Prometheus monitoring for observability. The monitoring is built into the main LangWatch chart and can be enabled with a simple configuration.Quick Setup
Access Prometheus
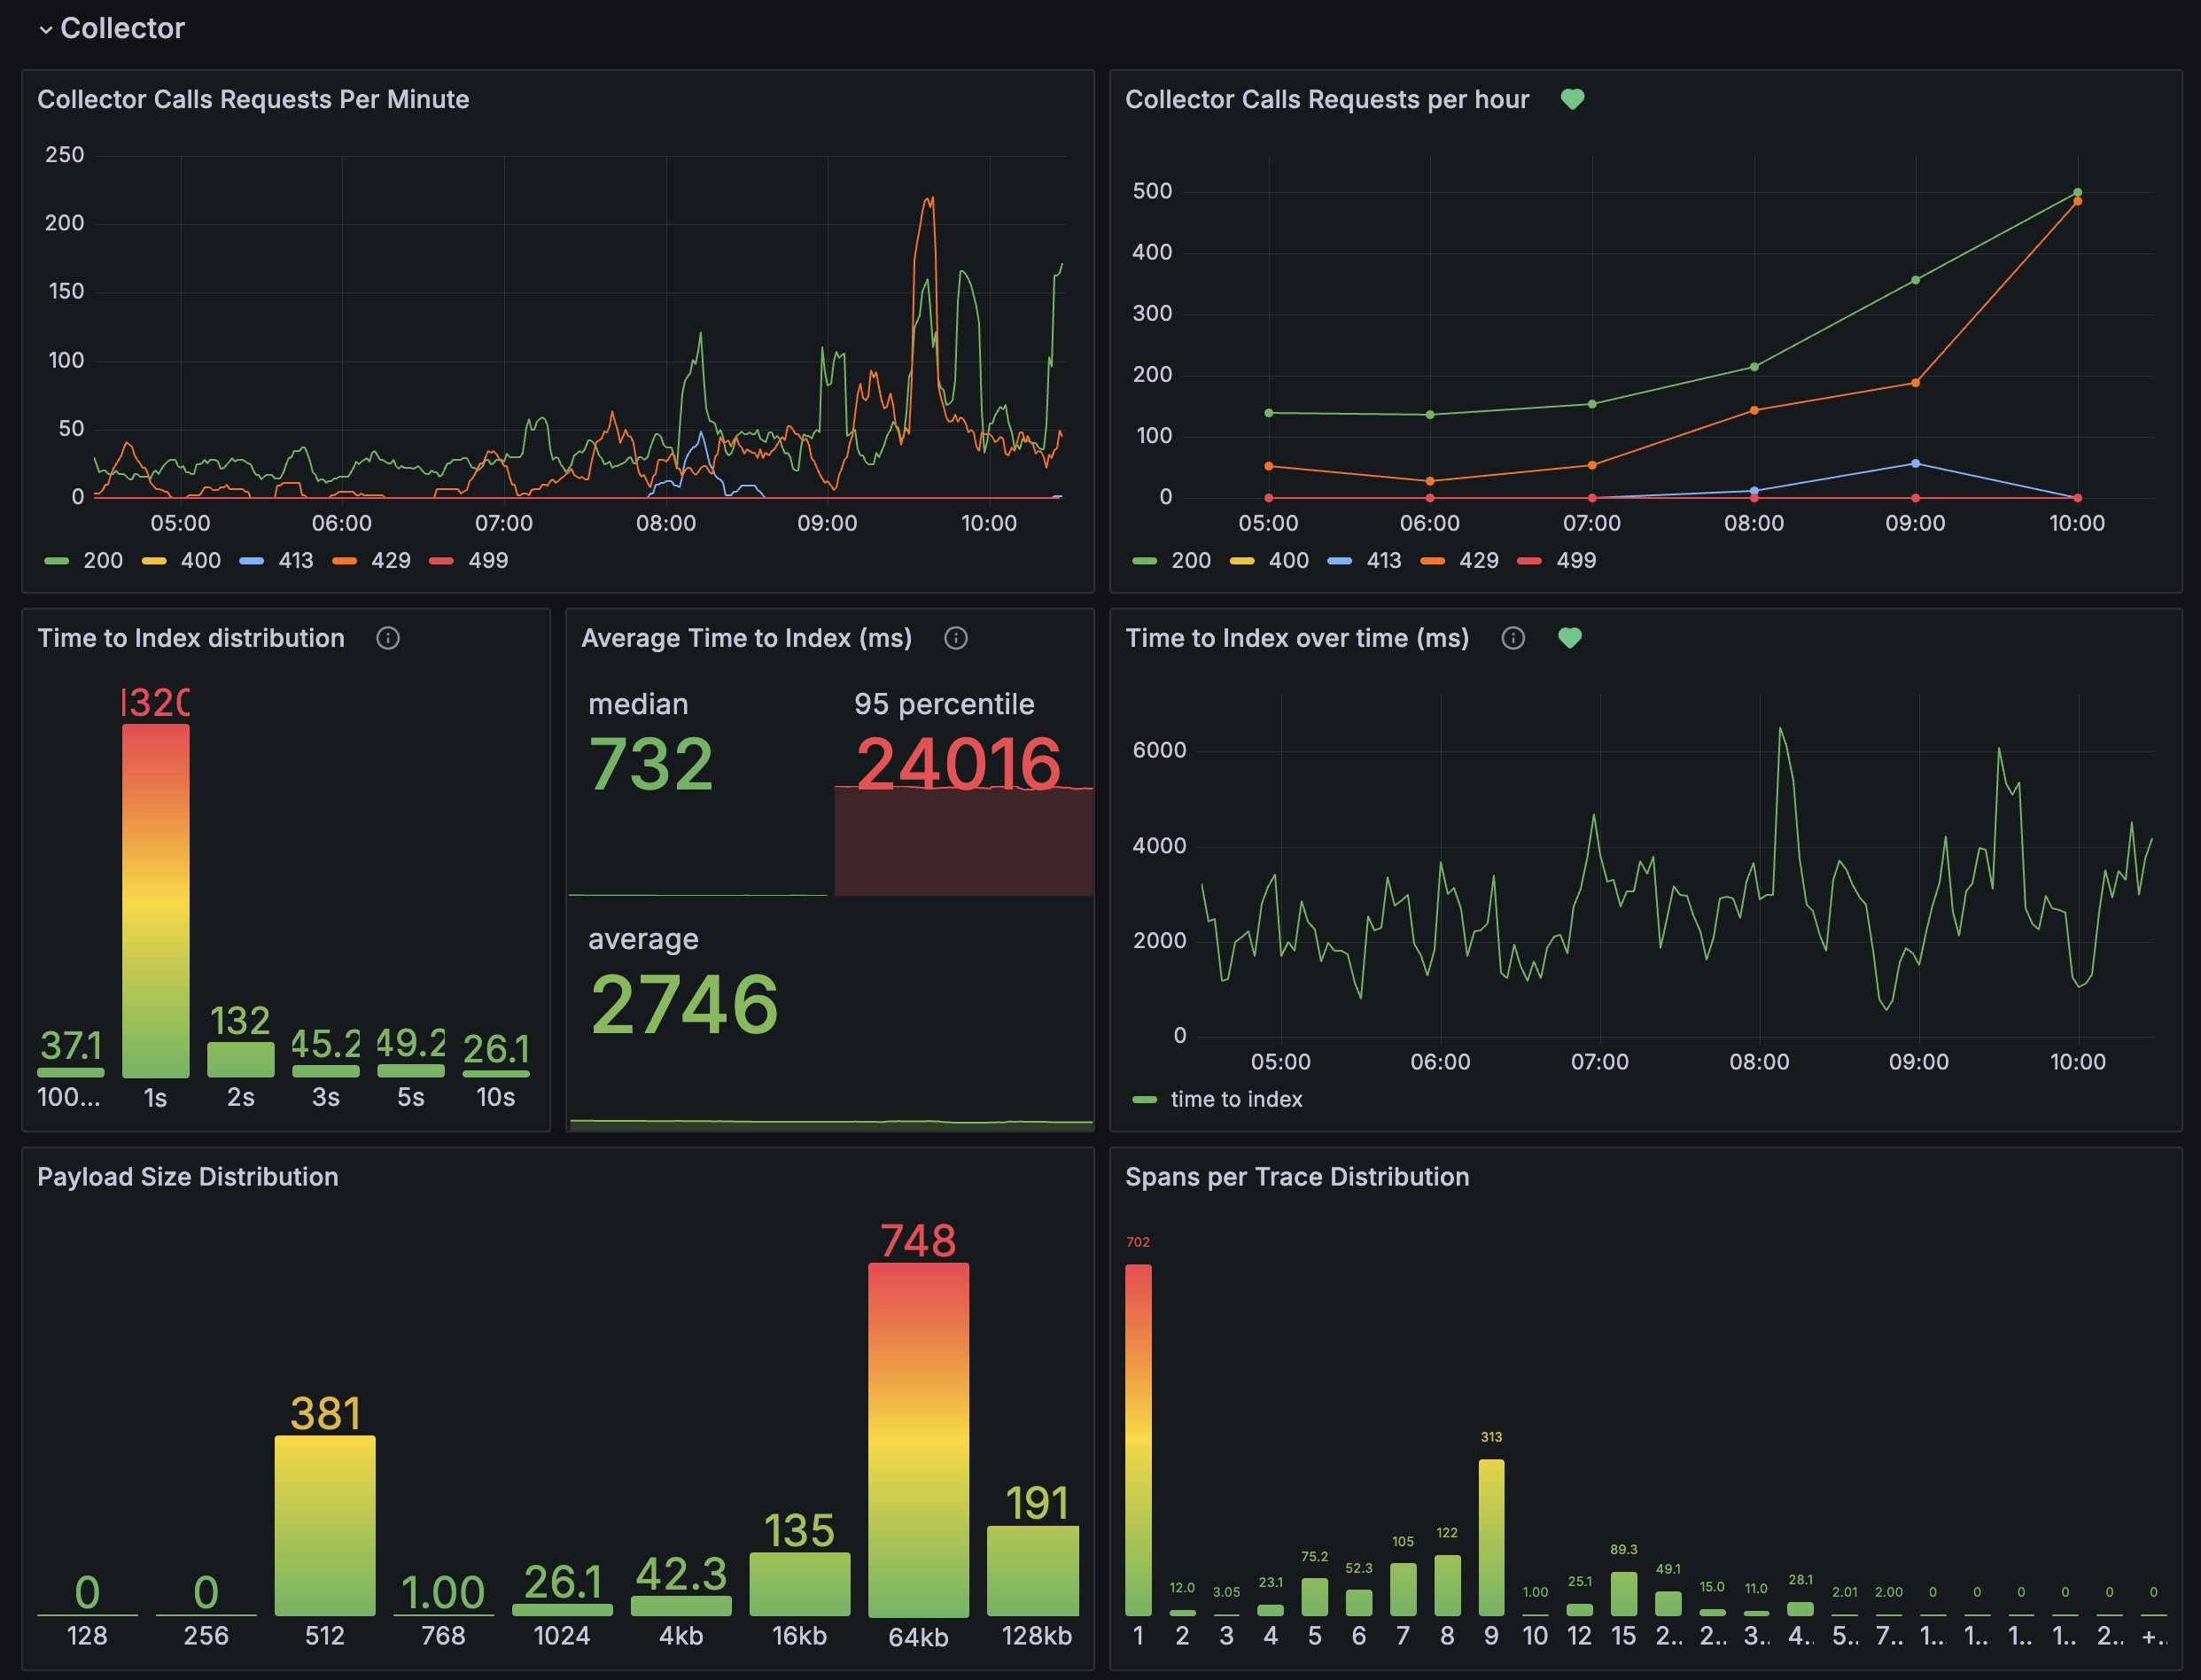
What Gets Monitored
- LangWatch App: Main application metrics (port 5560)
- LangWatch Workers: Worker metrics (port 2999)
- Kubernetes Infrastructure: Node and container metrics via cAdvisor
Prometheus Configuration
The Prometheus configuration can be customized through theprometheus section in values.yaml:
LangWatch Pod Annotations
For Prometheus to discover your LangWatch pods, ensure they have the correct annotations:LangWatch Dashboard
You can find the LangWatch dashboard template here.