Key Features
- Self-hosted on your AWS, Google Cloud, Azure or any other instances
- Full control over your data
- Feature parity with the SaaS version
- Scalable to enterprise needs
- Hosted in preferred region (e.g. eu-central-1 for GDPR compliance)
- Installation and maintenance service
- Dedicated support agent to help you optimize your deployment
- Purchase and billing option through AWS Marketplace to facilitate procurement
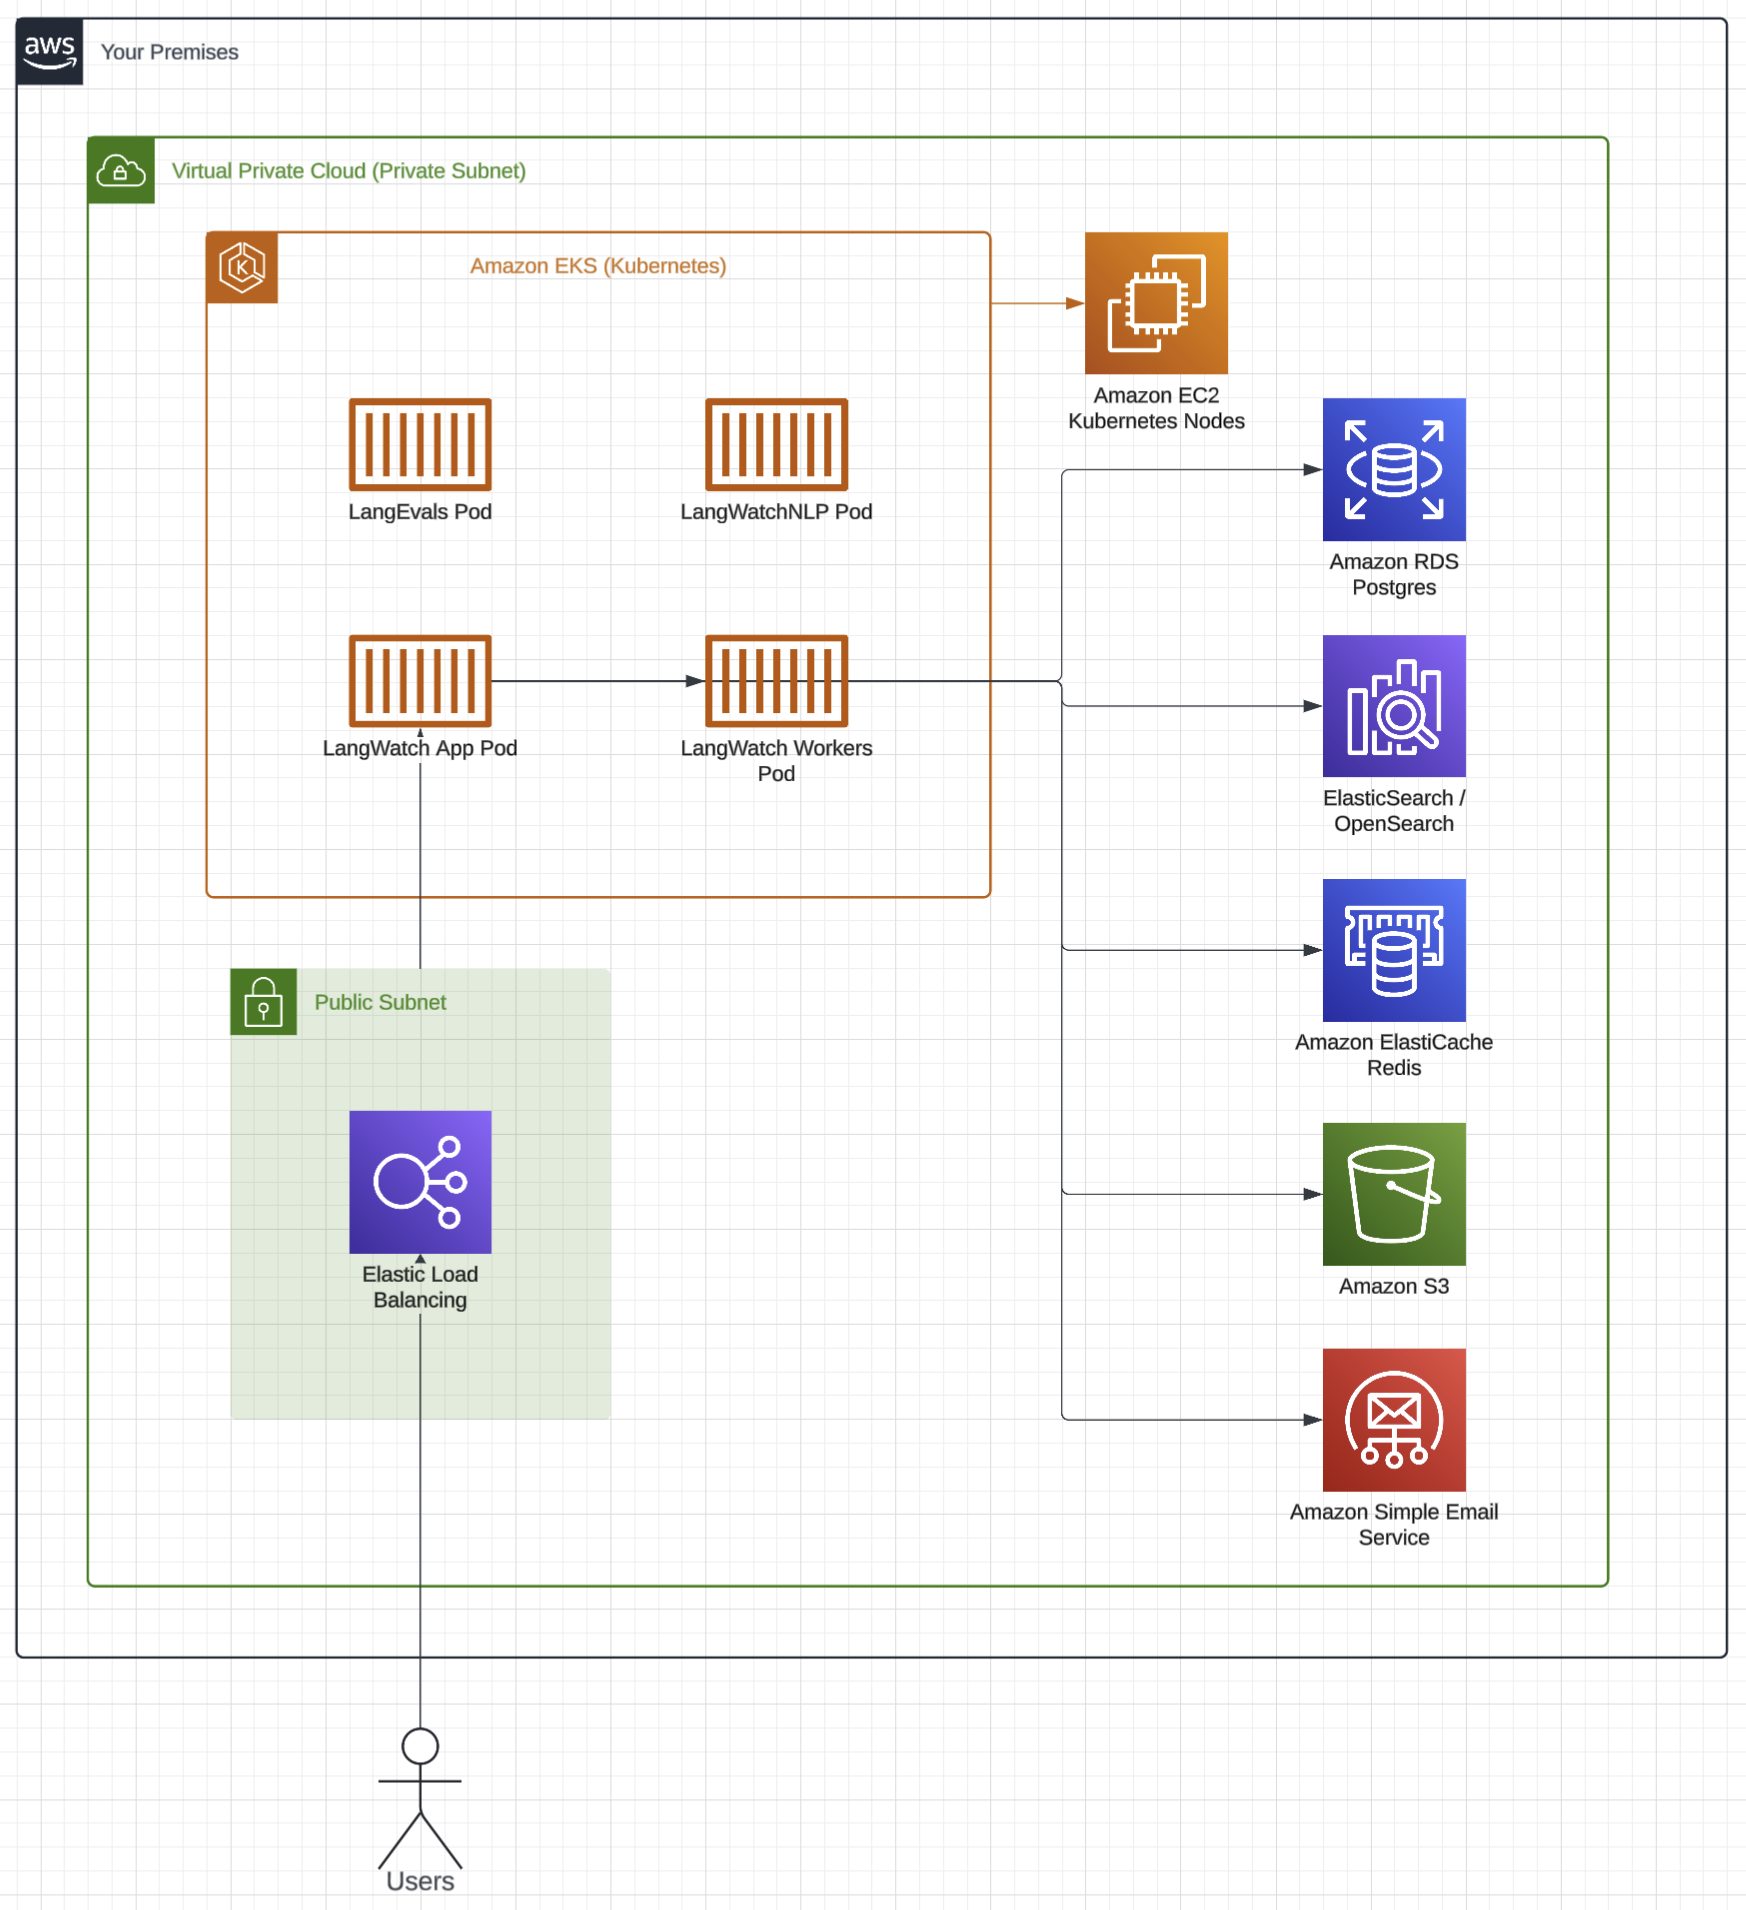
Infrastructure Diagram
Check out below a high-level diagram of how the LangWatch on-premises infrastructure is deployed on the cloud provider.- AWS
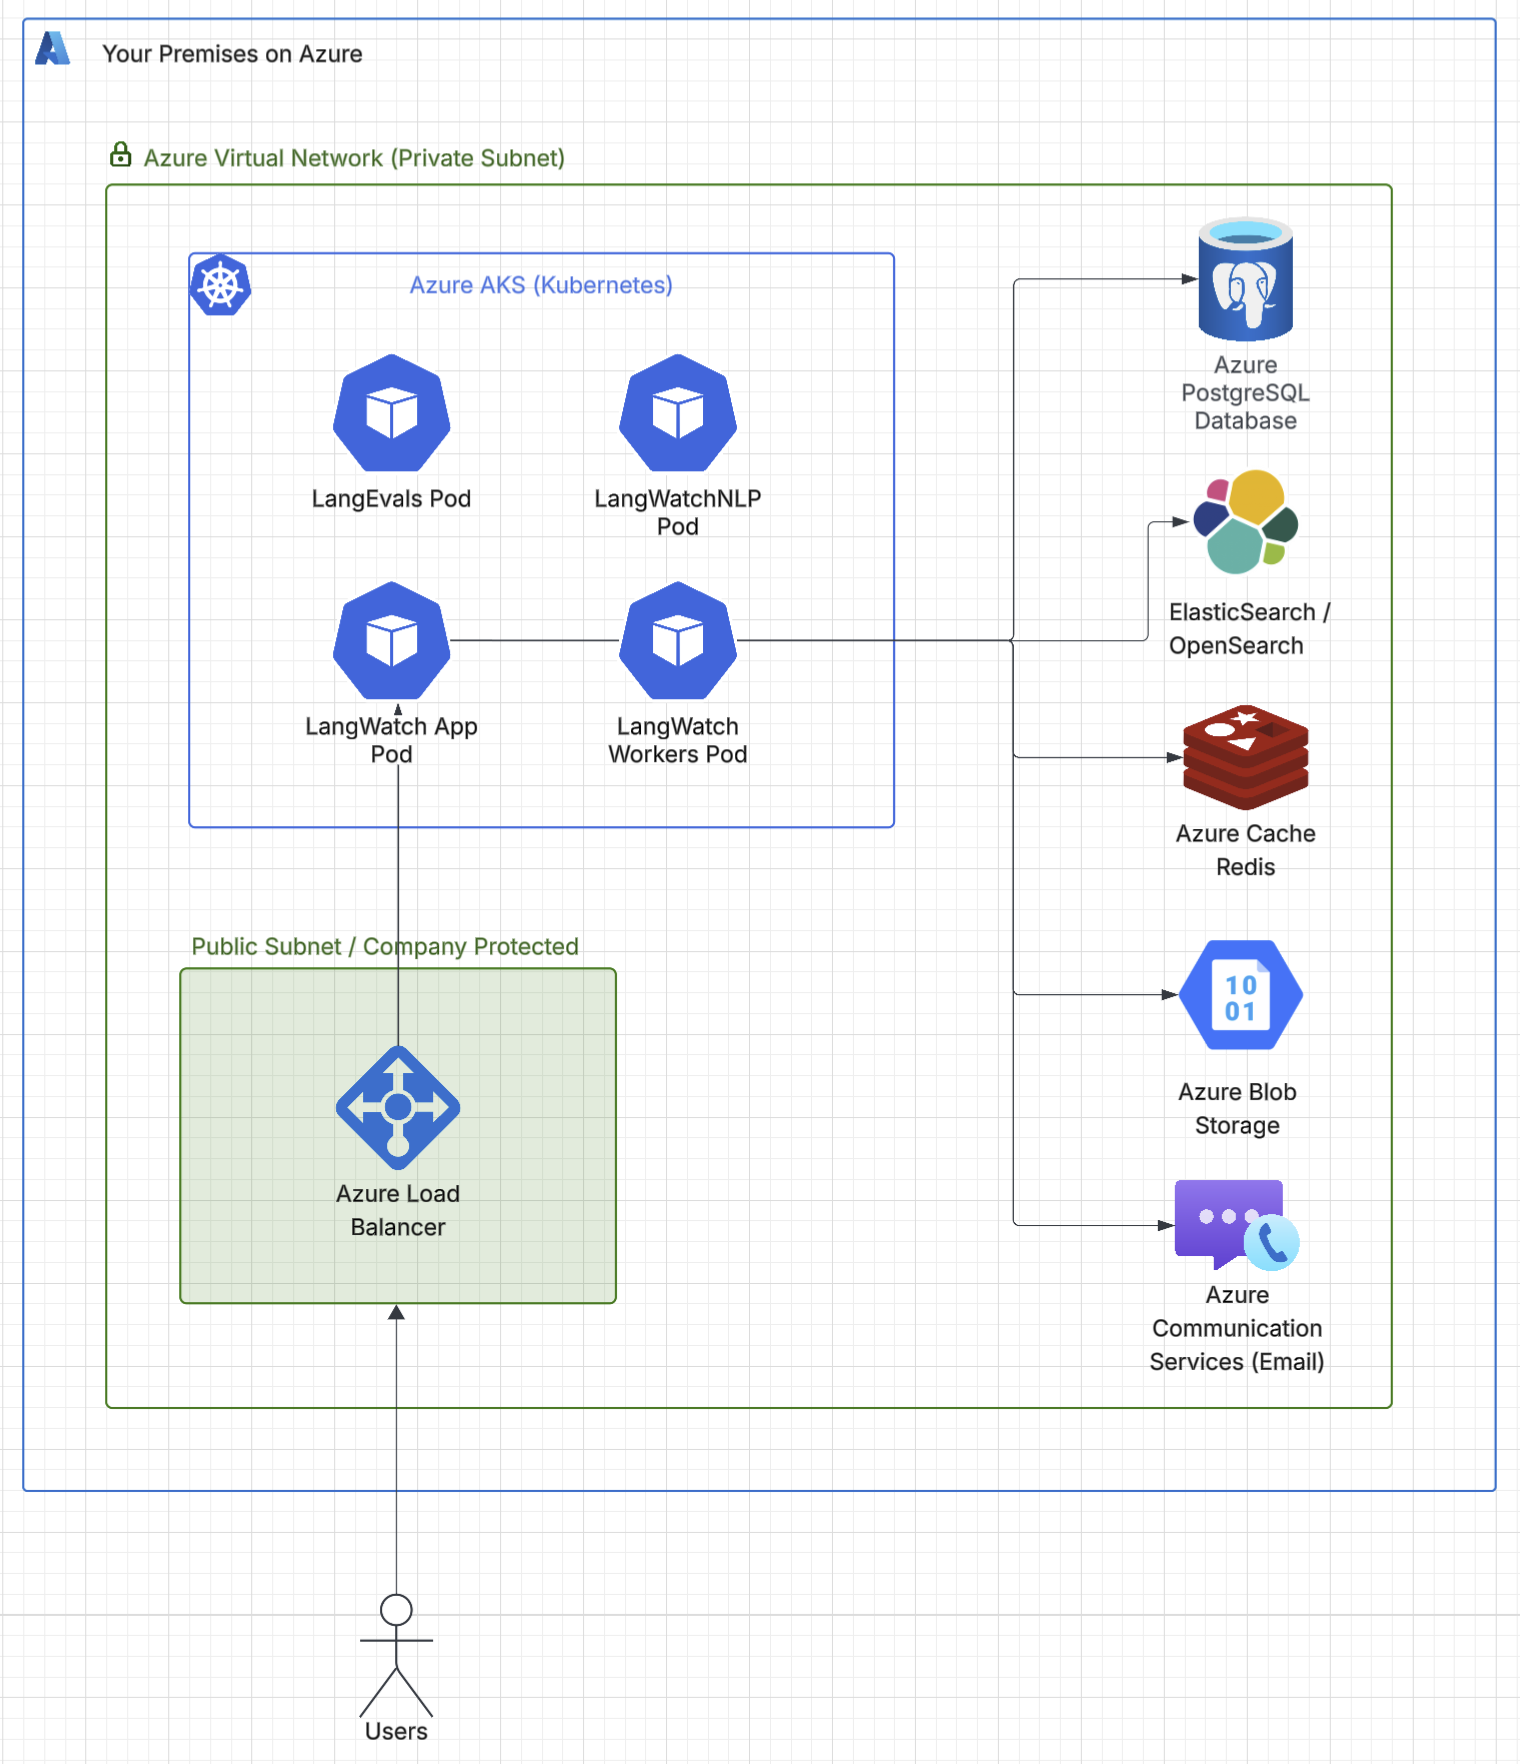
- Azure
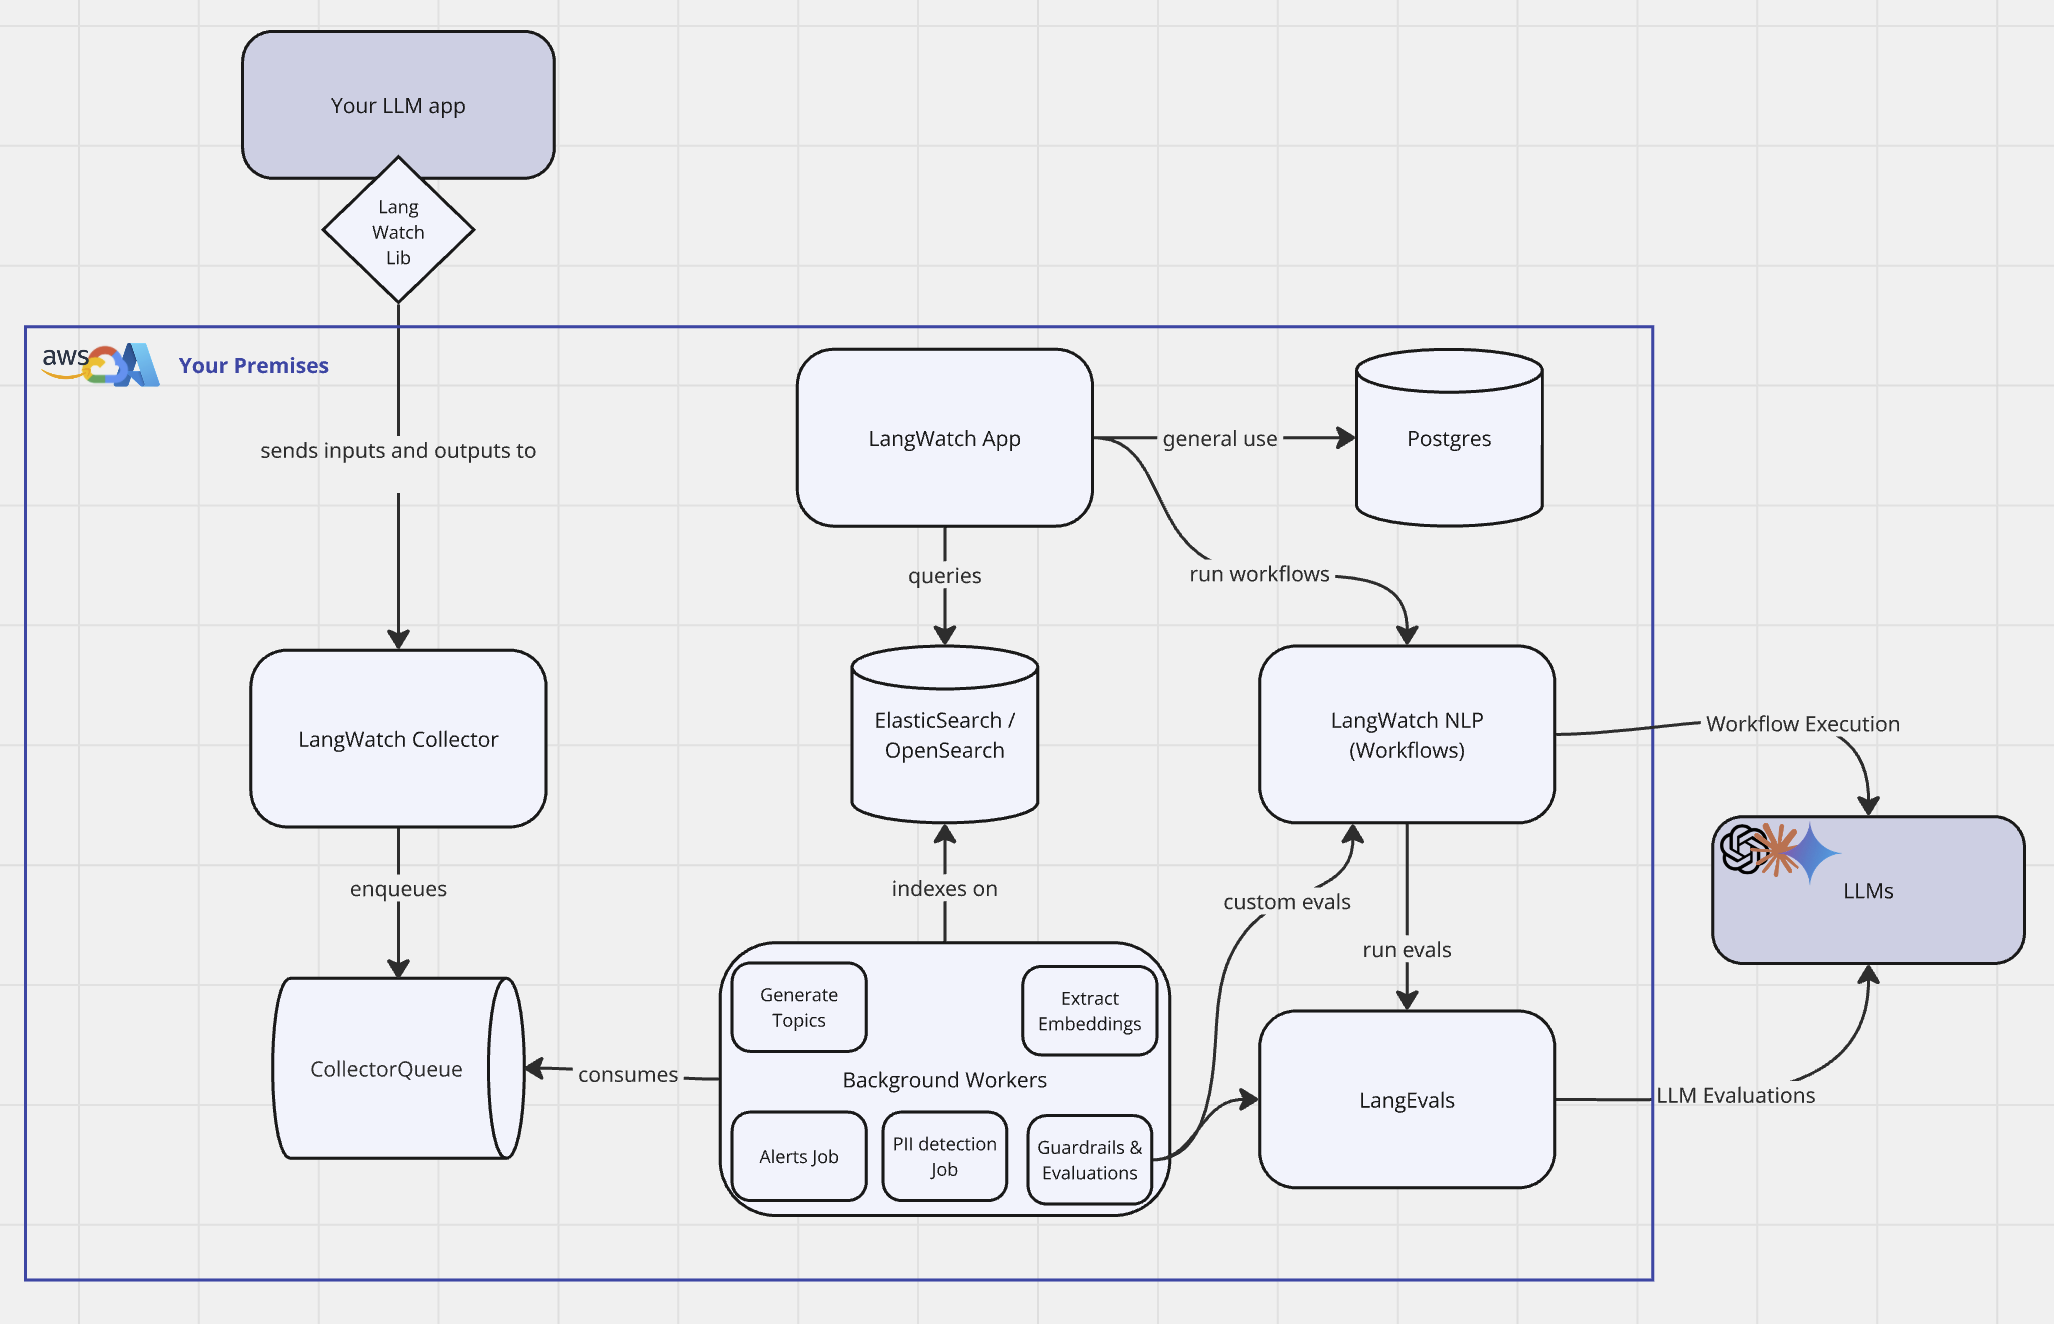
Data Flow Diagram
To understand how the data flows through the platform, check out the diagram below: