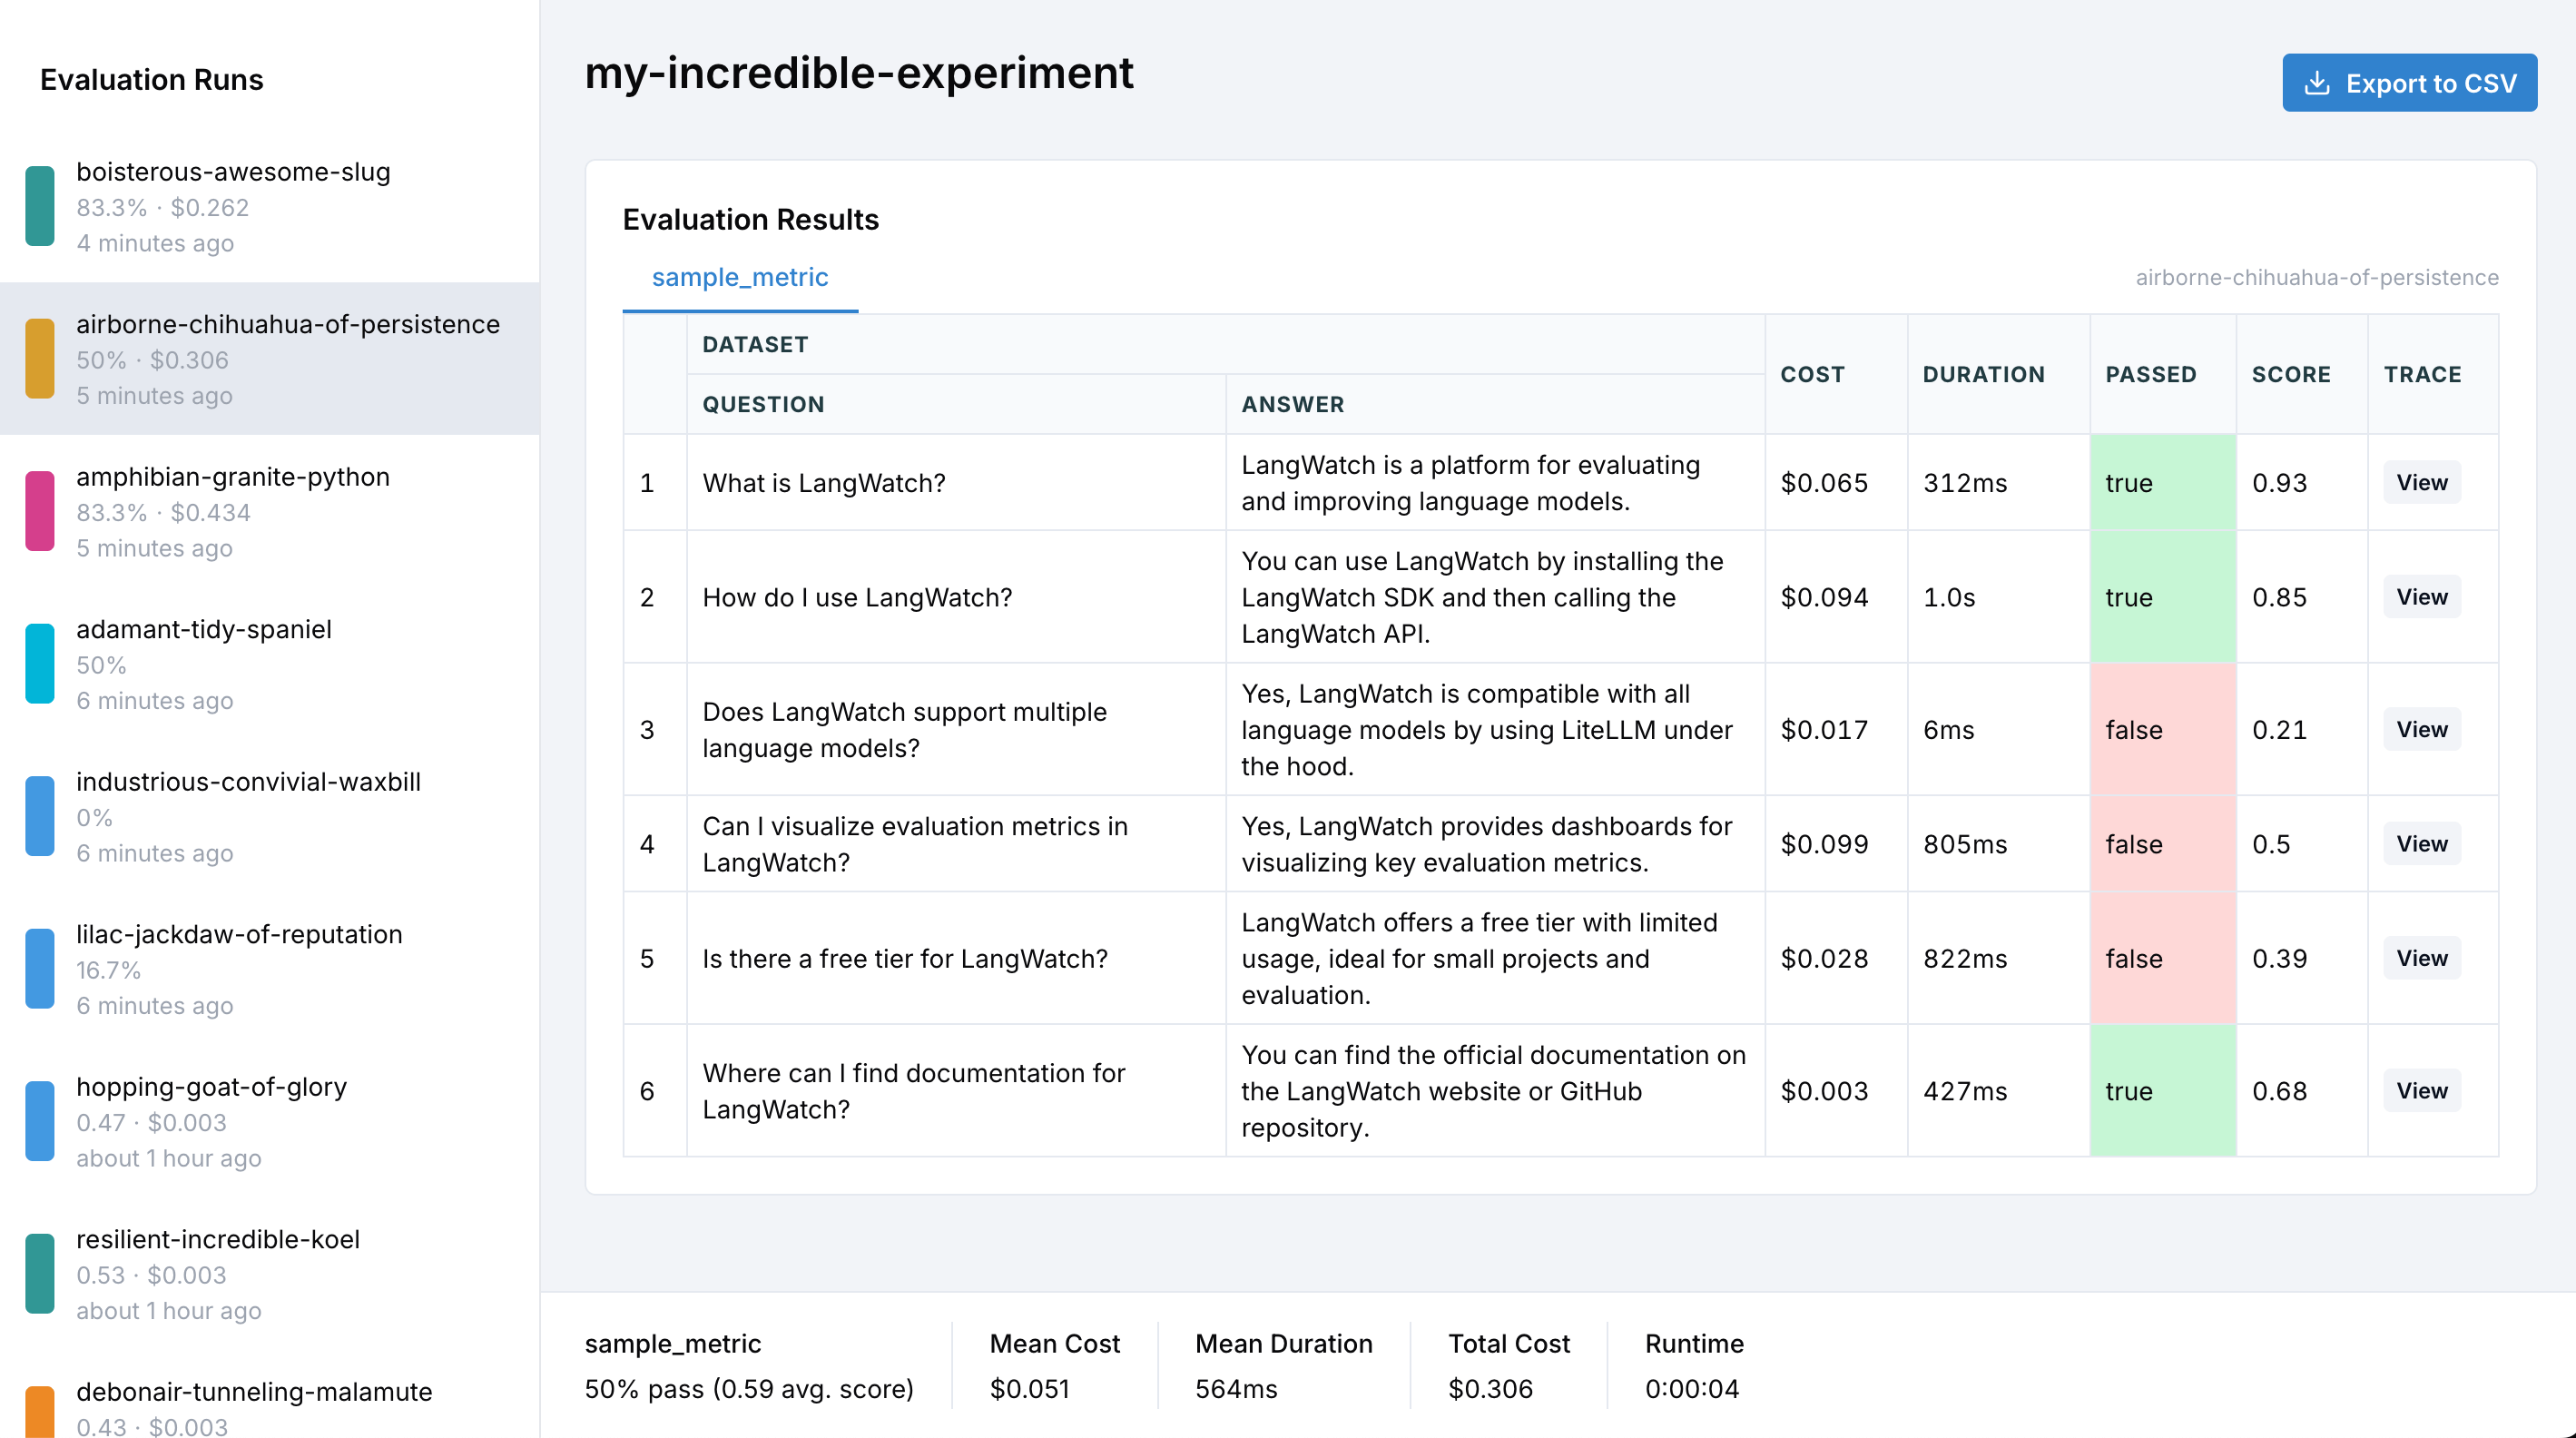
LangWatch makes it incredibly easy to add evaluation tracking to your existing workflows.
You can keep using pandas and your favorite tools, just add a few lines to start tracking your experiments.
Quickstart
1. Install the Python library
2. Login to LangWatch
Import and authenticate the LangWatch SDK:
import langwatch

langwatch.login()
export LANGWATCH_API_KEY=your_api_key
3. Start tracking
import langwatch
import pandas as pd

# Load your dataset
df = pd.read_csv("my_dataset.csv")

# Initialize a new experiment
evaluation = langwatch.evaluation.init("my-experiment")

# Wrap your loop with evaluation.loop(), and iterate as usual
for idx, row in evaluation.loop(df.iterrows()):
    # Run your model or pipeline
    response = my_agent(row["question"])

    # Log a metric for this sample
    evaluation.log("sample_metric", index=idx, score=0.95)
Core Concepts
Evaluation Initialization
The evaluation is started by creating an evaluation session with a descriptive name:
evaluation = langwatch.evaluation.init("rag-pipeline-openai-vs-claude")
Loop wrapping
Use evaluation.loop() around your iterator so the entries are tracked:
for index, row in evaluation.loop(df.iterrows()):
    # Your existing evaluation code
Metrics logging
Track any metric you want with evaluation.log():
# Numeric scores
evaluation.log("relevance", index=index, score=0.85)

# Boolean pass/fail
evaluation.log("contains_citation", index=index, passed=True)

# Include additional data for debugging
evaluation.log("coherence", index=index, score=0.9,
               data={"output": result["text"], "tokens": result["token_count"]})
Use LangWatch Datasets
Collaborate with your team using datasets stored in LangWatch:
# Load dataset from LangWatch
df = langwatch.dataset.get_dataset("dataset-id").to_pandas()

evaluation = langwatch.evaluation.init("team-shared-eval")

for index, row in evaluation.loop(df.iterrows()):
    # Your evaluation logic
Create and manage datasets in the LangWatch UI. See our Datasets Overview for more details. Capture Full Pipeline
Add Custom Data
Beyond just metrics, you can capture outputs and other relevant data for analysis:
result = agent(row["question"])

evaluation.log("helpfulness",
               index=index,
               score=0.88,
               data={
                  "response": result["text"],
                  "contexts": result["contexts"]
               })
Trace Your LLM Pipeline
To get complete visibility into your LLM pipeline, trace your agent with the @langwatch.trace() decorator:
@langwatch.trace()
def agent(question):
    # Your RAG pipeline, chain, or agent logic
    context = retrieve_documents(question)
    completion = llm.generate(question, context)
    return {"text": completion.text, "context": context}

for index, row in evaluation.loop(df.iterrows()):
    result = agent(row["question"])
    evaluation.log("accuracy", index=index, score=0.9)
With tracing enabled, you can click through from any evaluation result to see the complete execution trace, including all LLM calls, prompts, and intermediate steps.Learn more in our Python Integration Guide. Parallel Execution
LLM calls can be slow. To speed up your evaluations, you can use the built-in parallelization,
by putting the content of the loop in a function and submitting it to the evaluation for
parallel execution:
evaluation = langwatch.evaluation.init("parallel-eval-example")

for index, row in evaluation.loop(df.iterrows(), threads=4):
    def evaluate(index, row):
        result = agent(row["question"])  # Runs in parallel
        evaluation.log("response_quality", index=index, score=0.92)

    evaluation.submit(evaluate, index, row)
By default, threads=4. Adjust based on your API rate limits and system resources.
Built-in Evaluators
LangWatch provides a comprehensive suite of evaluation metrics out of the box. Use evaluation.run() to leverage pre-built evaluators:
for index, row in evaluation.loop(df.iterrows()):
    def evaluate(index, row):
        response, contexts = execute_rag_pipeline(row["question"])

        # Use built-in RAGAS faithfulness evaluator
        evaluation.run(
            "ragas/faithfulness",
            index=index,
            data={
                "input": row["question"],
                "output": response,
                "contexts": contexts,
            },
            settings={
                "model": "openai/gpt-5",
                "max_tokens": 2048,
            }
        )

        # Log custom metrics alongside
        evaluation.log("confidence", index=index, score=response.confidence)

    evaluation.submit(evaluate, index, row)
Browse our complete list of available evaluators including metrics for RAG quality, hallucination detection, safety, and more. Complete Example
Here’s a full example combining all the features:
import langwatch

# Load dataset from LangWatch
df = langwatch.dataset.get_dataset("your-dataset-id").to_pandas()

# Initialize evaluation
evaluation = langwatch.evaluation.init("rag-pipeline-evaluation-v2")

# Run evaluation with parallelization
for index, row in evaluation.loop(df.iterrows(), threads=8):
    def evaluate(index, row):
        # Execute your RAG pipeline
        response, contexts = execute_rag_pipeline(row["question"])

        # Use LangWatch evaluators
        evaluation.run(
            "ragas/faithfulness",
            index=index,
            data={
                "input": row["question"],
                "output": response,
                "contexts": contexts,
            },
            settings={
                "model": "openai/gpt-5",
                "max_tokens": 2048,
                "autodetect_dont_know": True,
            }
        )

        # Log custom metrics
        evaluation.log(
            "response_time",
            index=index,
            score=response.duration_ms,
            data={"timestamp": response.timestamp}
        )

    evaluation.submit(evaluate, index, row)
What’s Next?
