1
Create your LangWatch account
First step: if you haven’t already, grab your LangWatch account. Head over to langwatch.ai, sign up, and get your API key ready.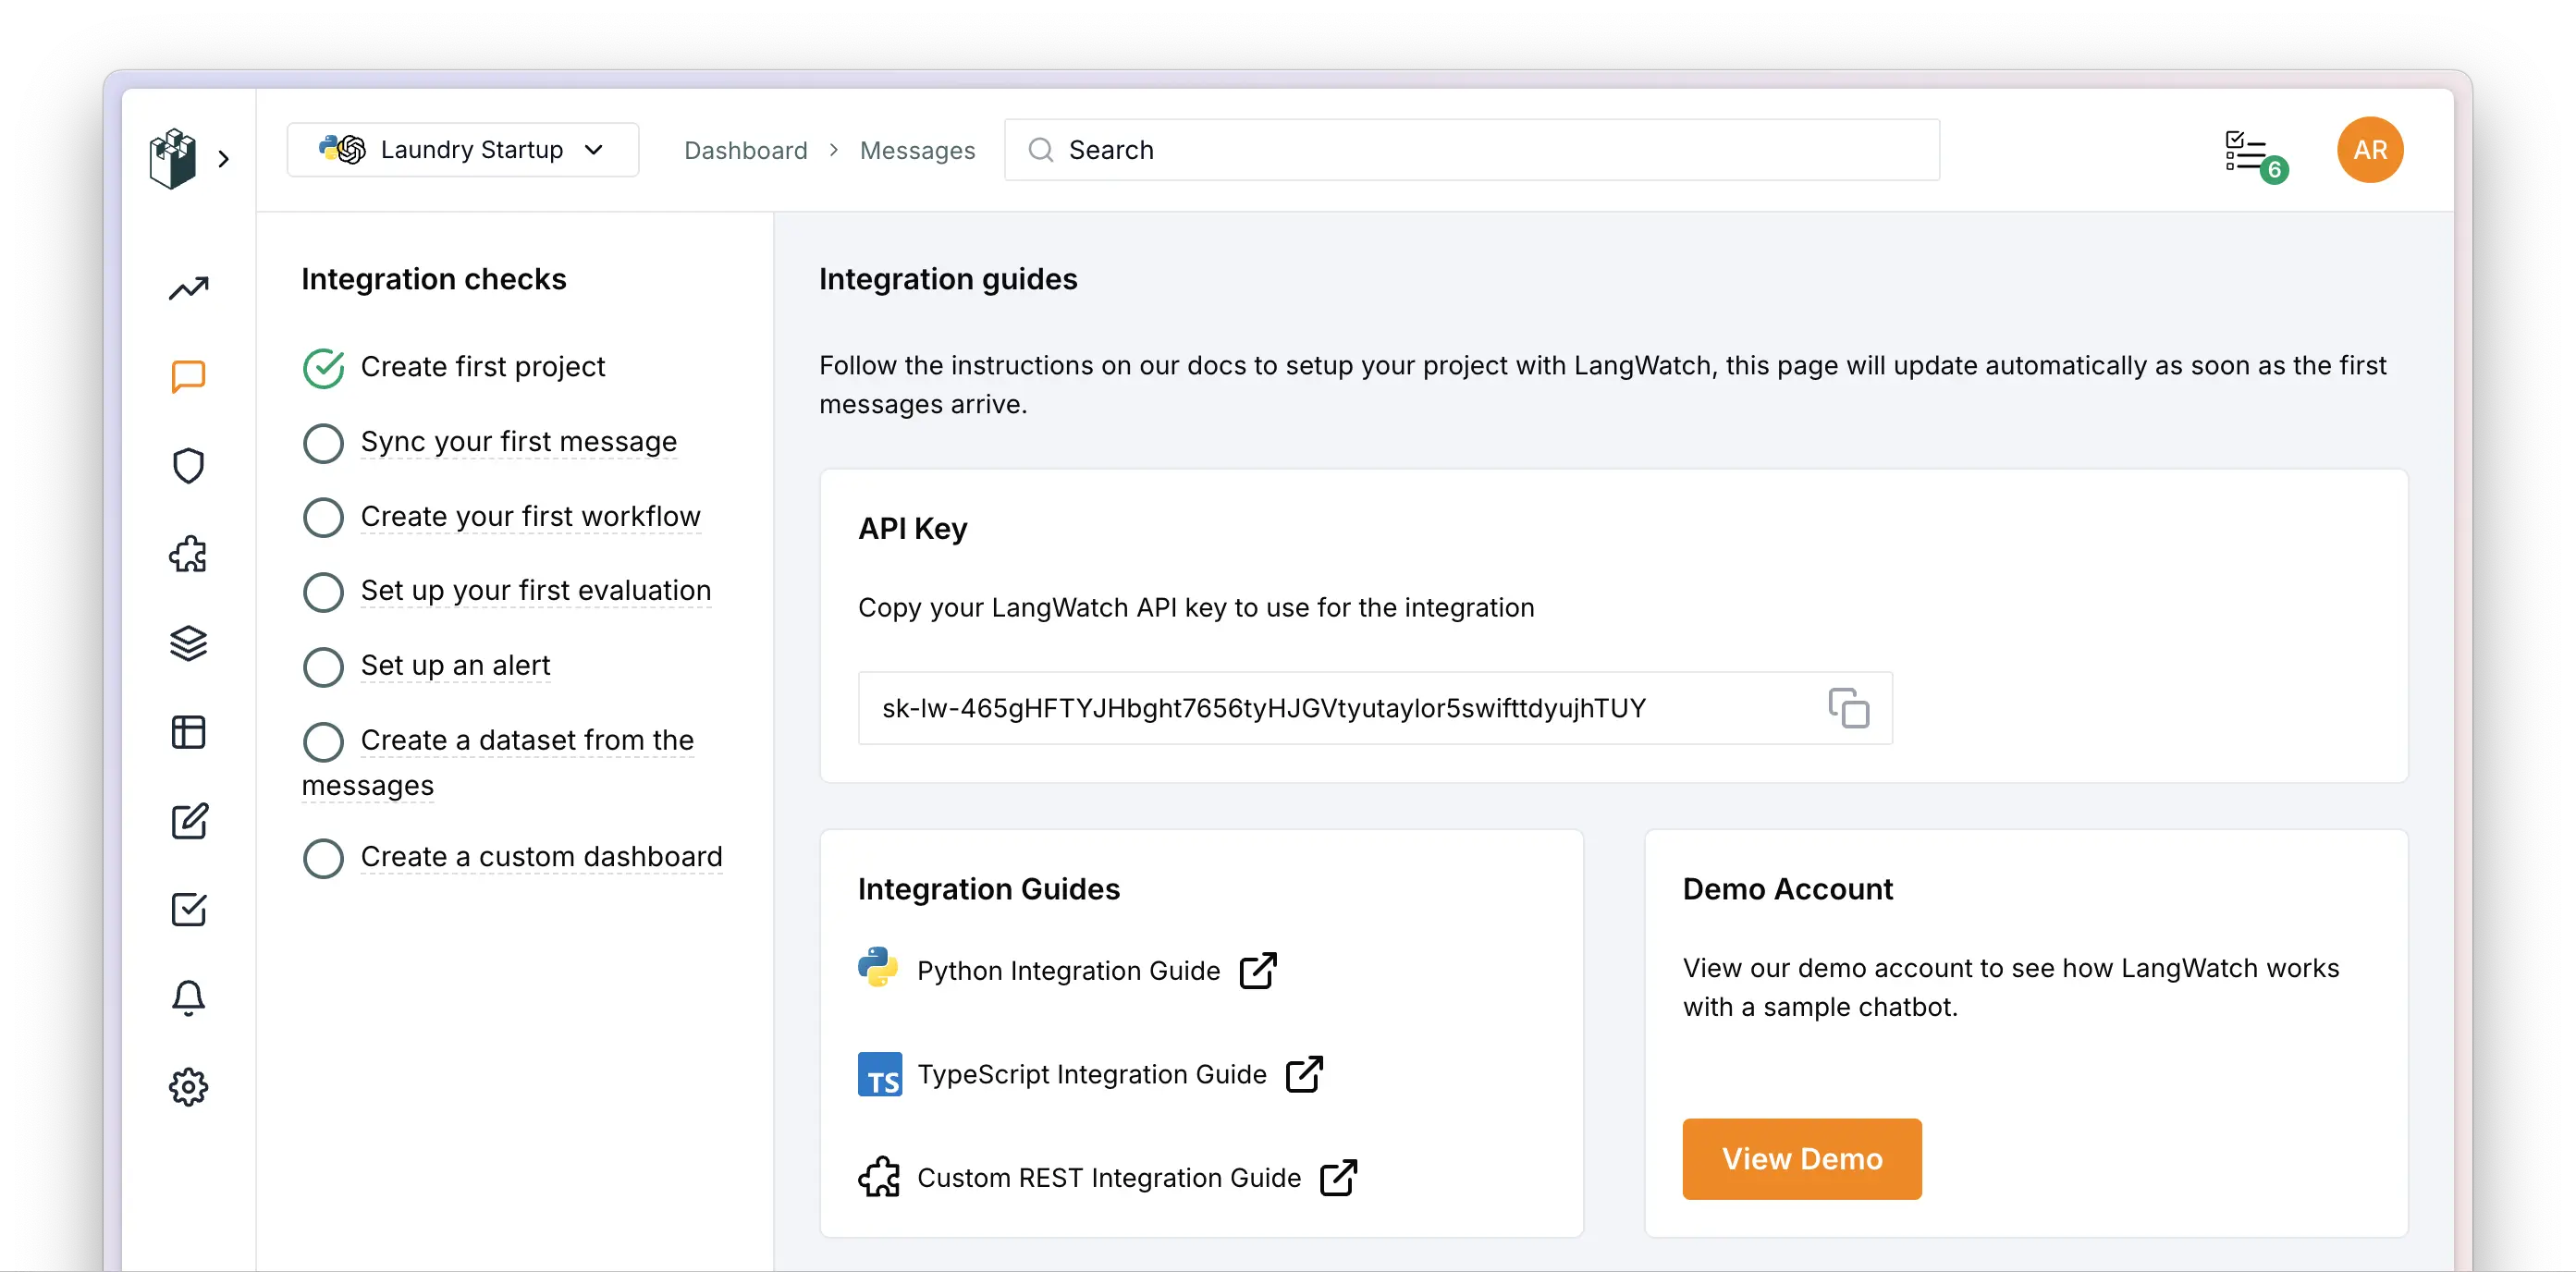
2
Sign in with LangWatch
Open a terminal and run the following command to sign in with LangWatch:This will add the
LANGWATCH_API_KEY to your local .env file.3
Let LangWatch MCP do the rest for you (Optional)
Install the LangWatch MCP Server and ask your coding assistant (Cursor, Claude Code, Codex, etc.) to instrument your codebase with LangWatch, OR keep following the steps below to instrument your codebase manually.Add the LangWatch MCP to your editor:Then ask your coding assistant to instrument your codebase with LangWatch:
4
Install the LangWatch SDK
We have official SDKs for Python and Node.js ready to go. If you’re using another language, our OpenTelemetry Integration Guide provides the details you need.
5
Add LangWatch to your project
Time to connect LangWatch. Initialize the SDK within your project. Here’s how you can set it up:
6
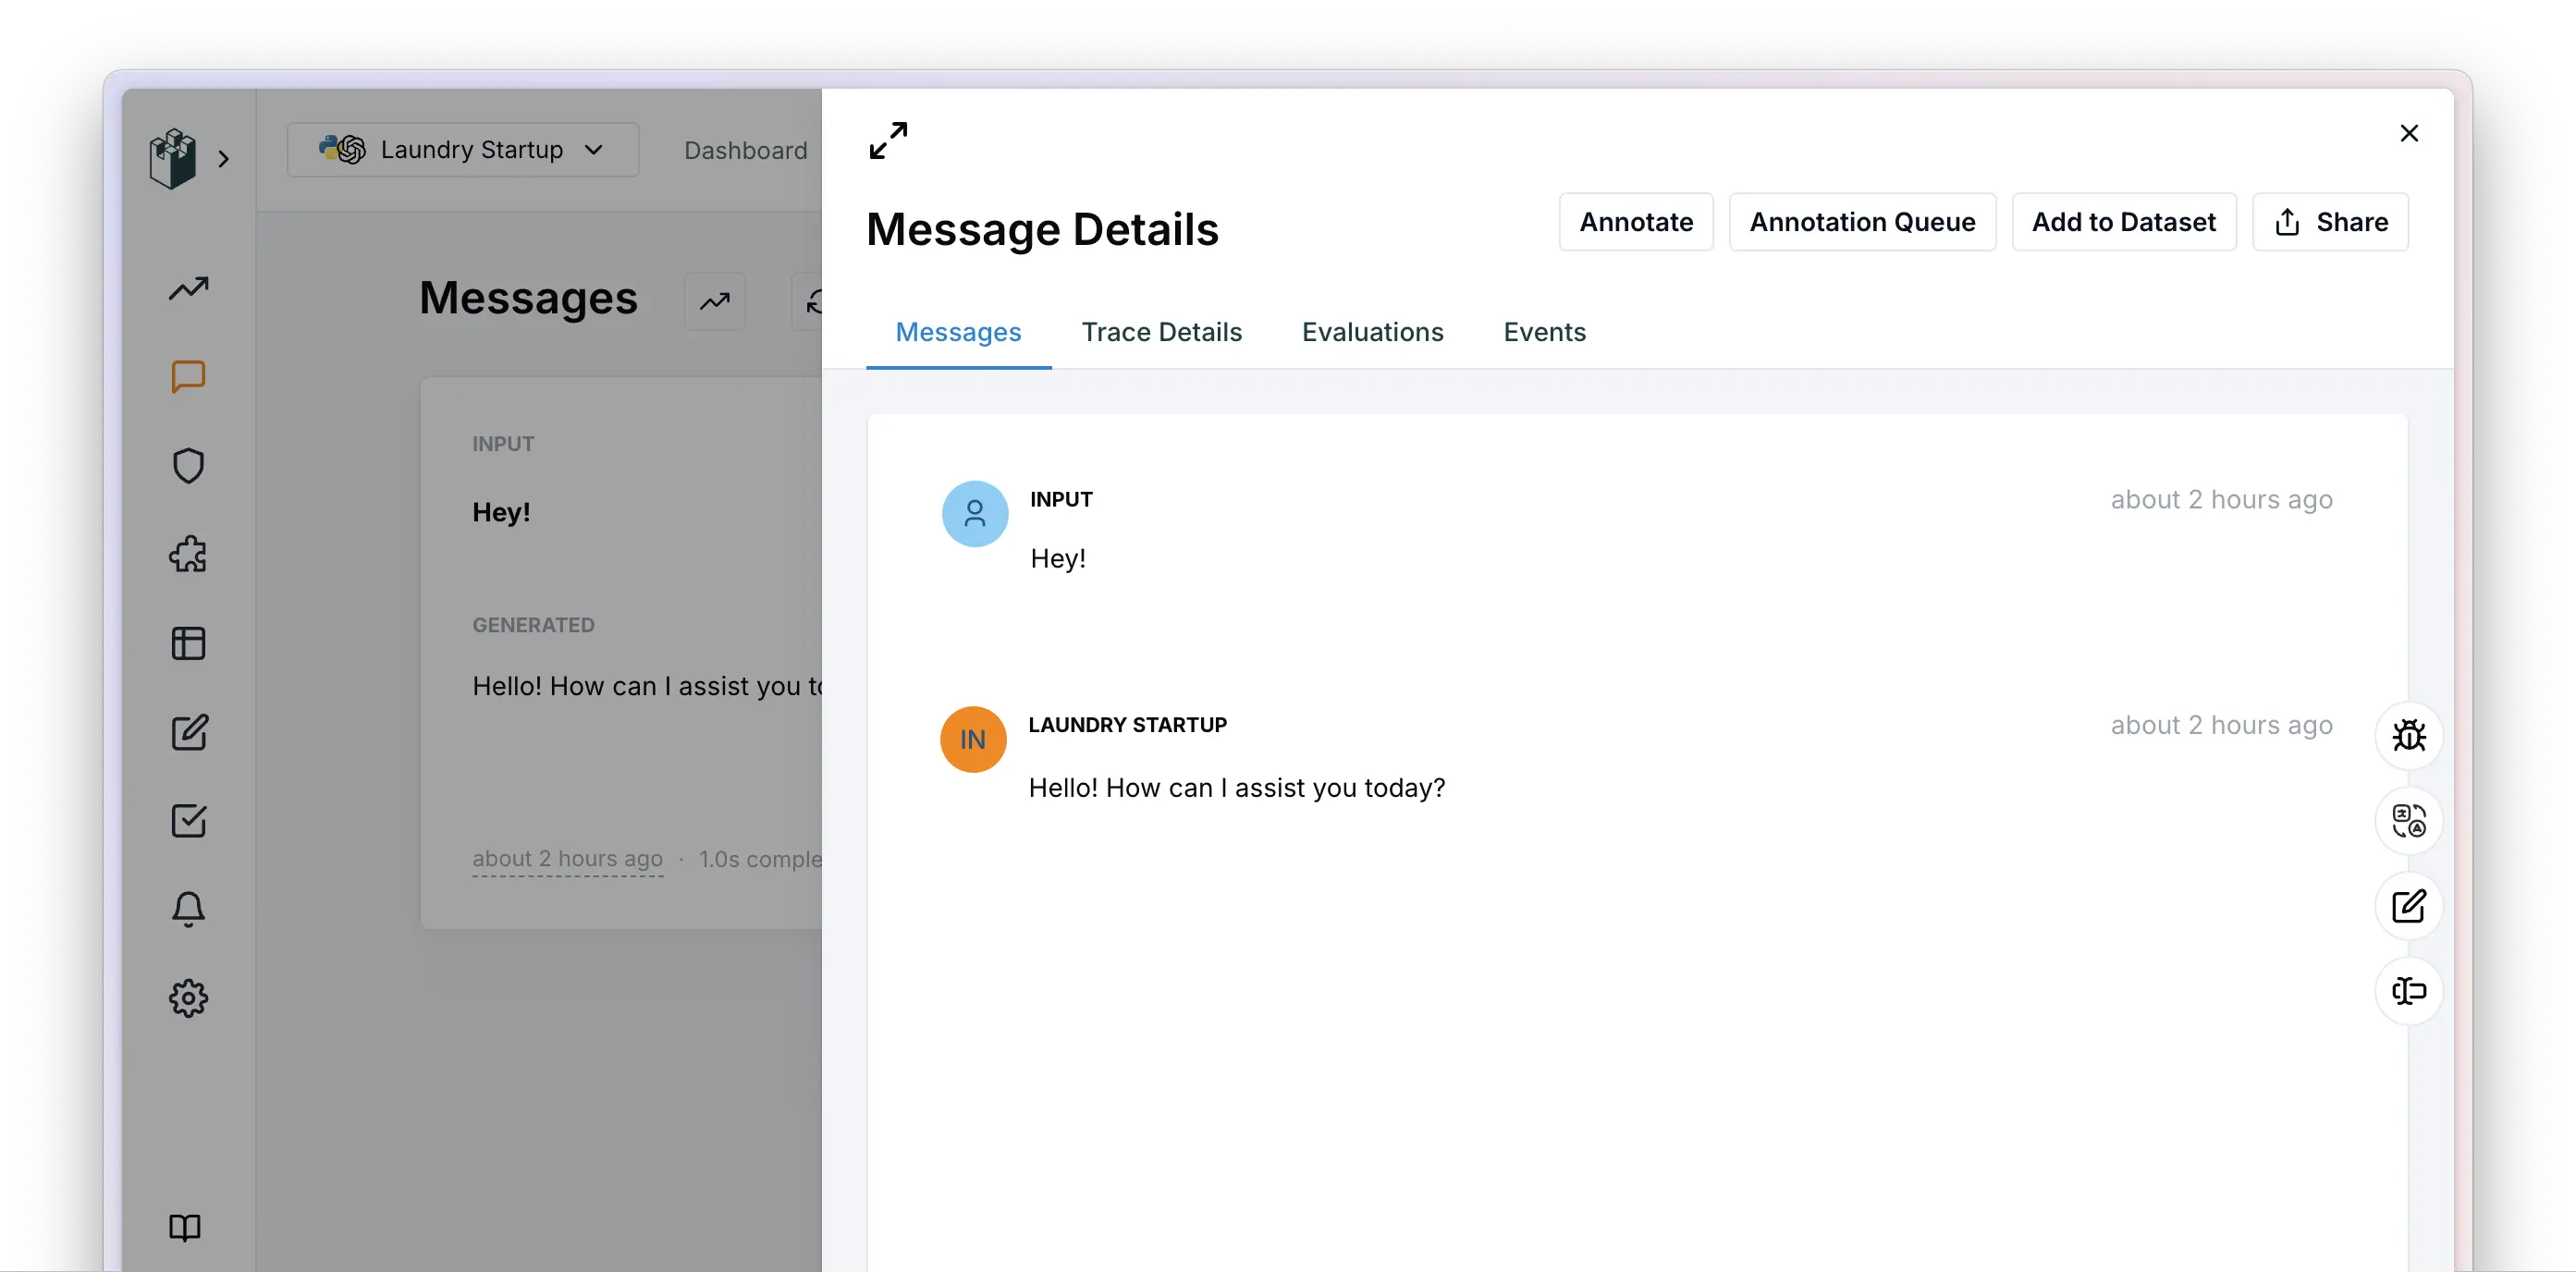
Start observing!
You’re all set! Jump into your LangWatch dashboard to see your data flowing in. You’ll find Traces (individual AI tasks) and their detailed Spans (the steps within), all organized into Threads (complete user sessions). Start exploring and use User IDs or custom Labels to dive deeper!