1. Install the Python library
- Notebook
- Command Line
2. Login to LangWatch
Import and authenticate the LangWatch SDK:3. Start tracking
Before your DSPy program compilation starts, initialize langwatch with your experiment name and the optimizer to be tracked:Follow your experiment
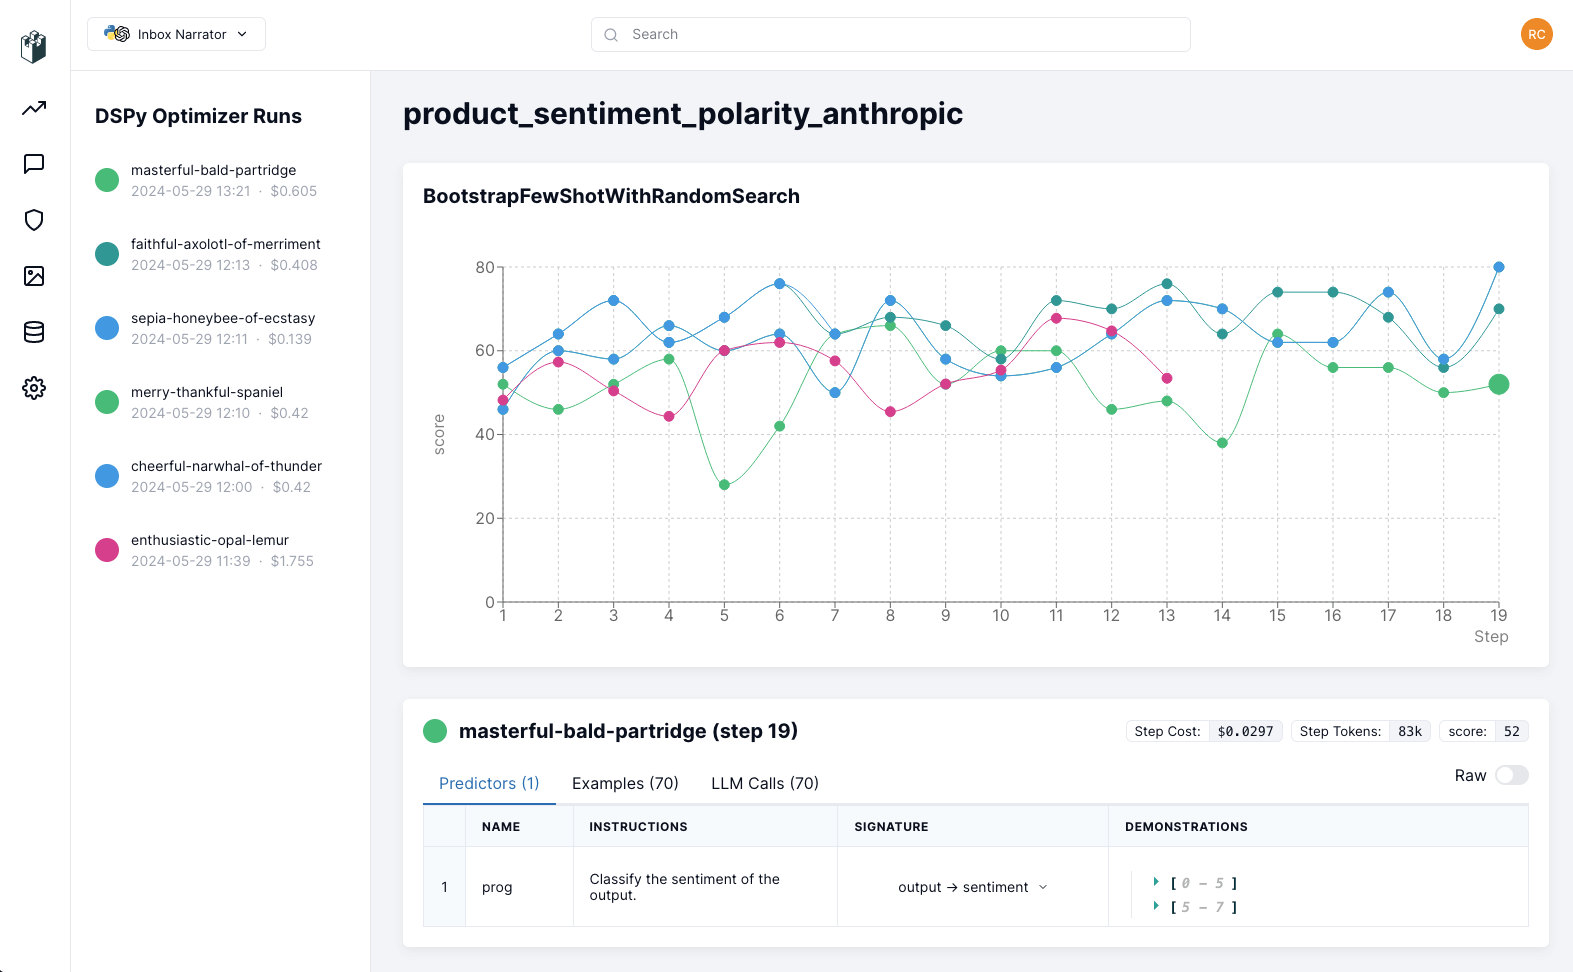
Open the link provided when the compilation starts or go to your LangWatch dashboard to follow the progress of your experiments:
Wrapping up
With your experiments tracked on LangWatch, now it’s time to explore how is the training going, take a look at the examples, the llm calls, the different steps and so on, so you can understand and hypothesize where you could improve your DSPy program, and keep iterating!When you are ready to deploy your DSPy program, you can monitor the inference traces on LangWatch dashboard as well. Check out the Python Integration Guide for more details.