Export Analytics with REST Endpoint
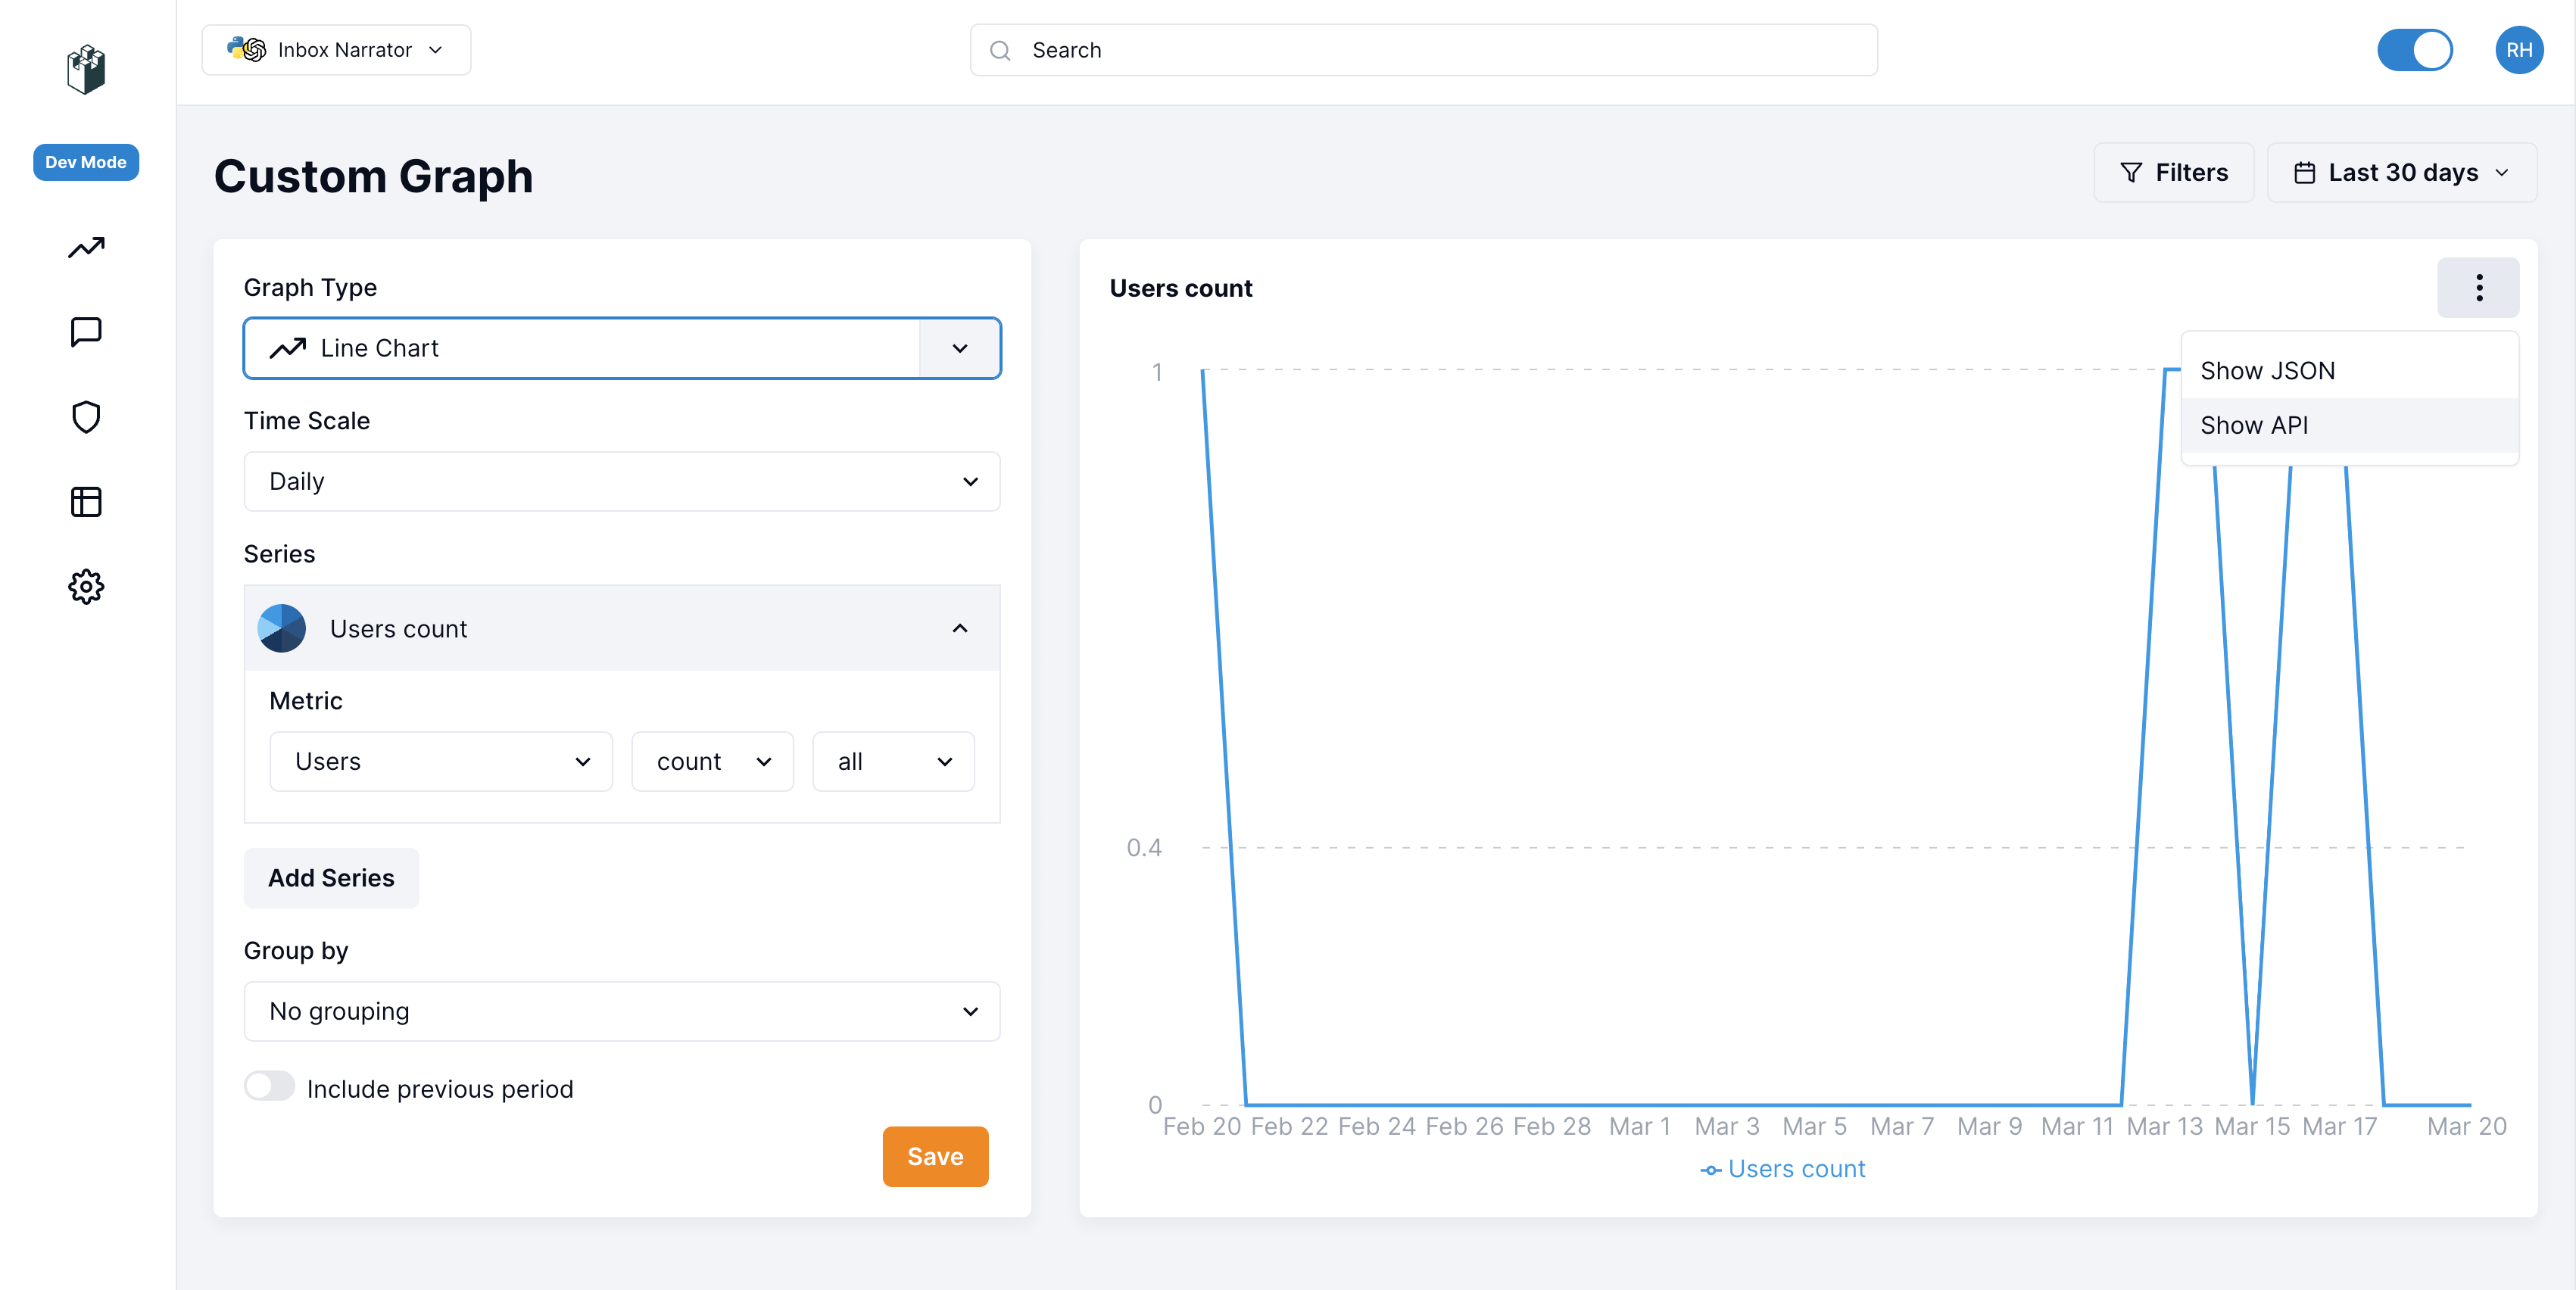
LangWatch offers you the possibility to build and integrate LangWatch graphs on your own systems and applications, to display it to your customers in another interface. On LangWatch dashboard, you can use our powerful custom chart builder tool, to plot any data collected and generated by LangWatch, and customize the way you want to display it. You can then use our REST API to fetch the graph data. Usage: You will need to obtain your JSON payload from the custom graph section in our application. You can find this on the Analytics page > Custom Reports > Add chart.- Pick the custom graph you want to get the analytics for.
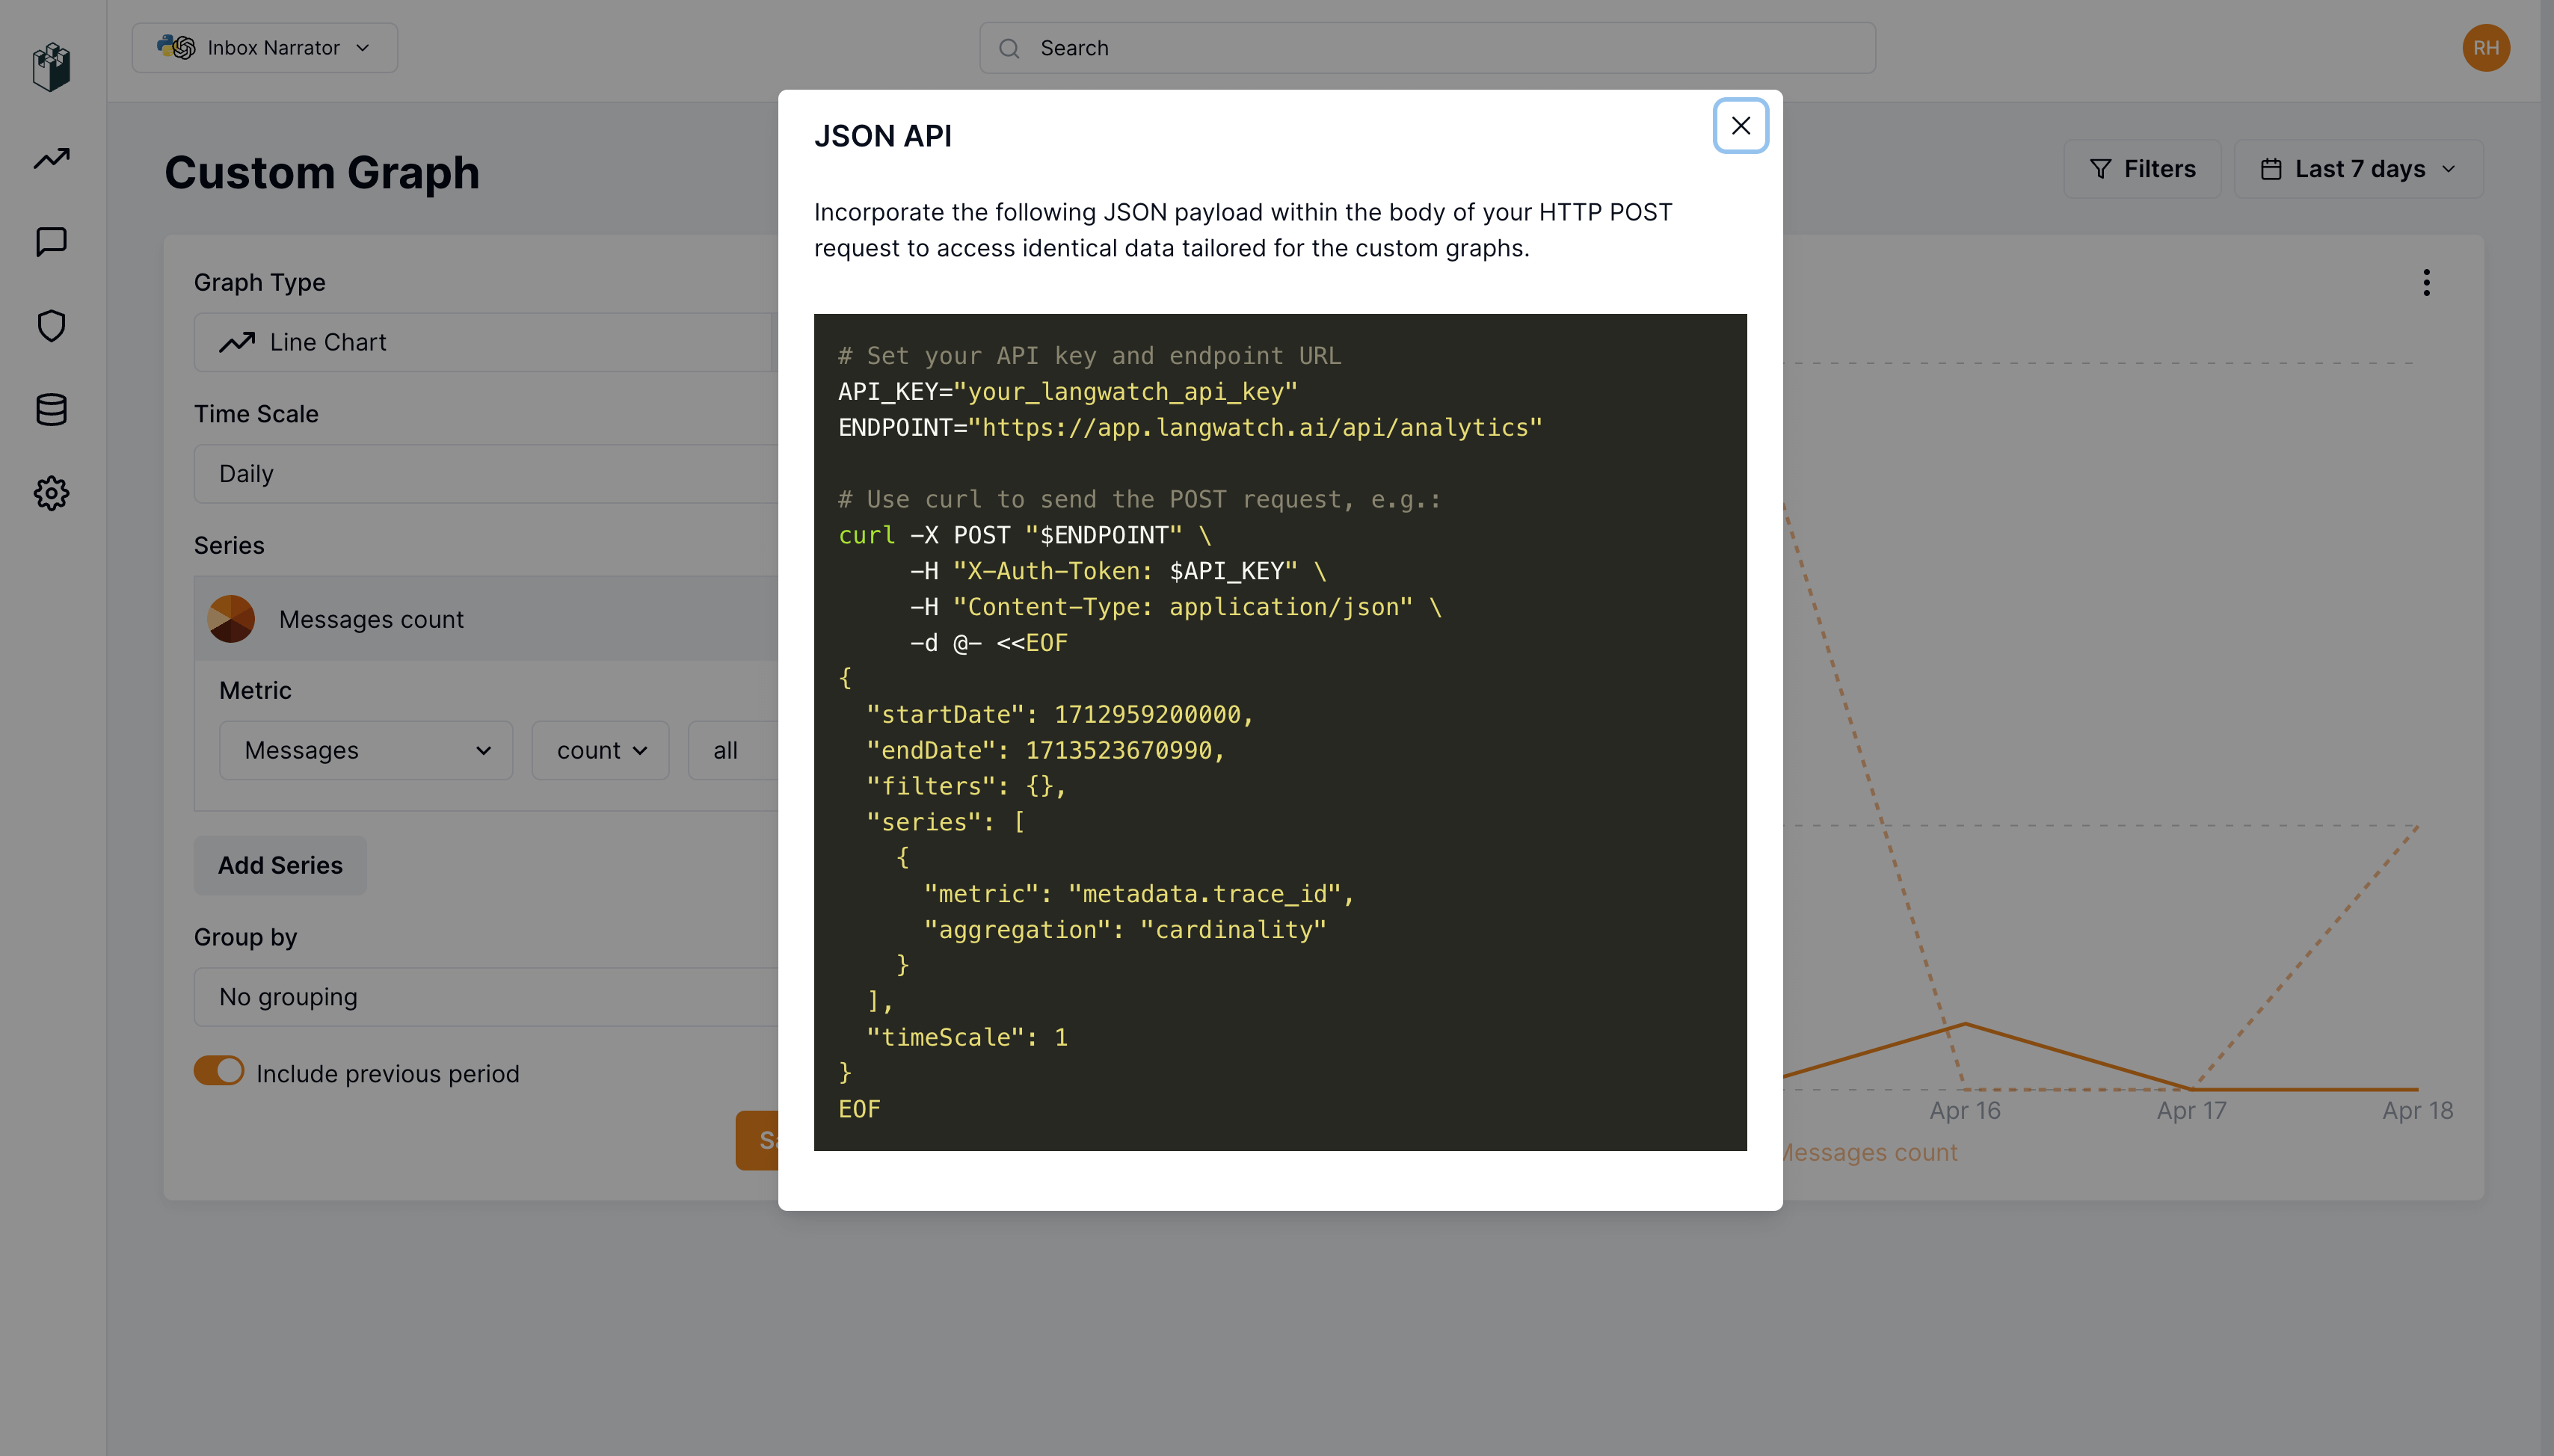
- Prepare your JSON data. Make sure it is the same format that is showing in the LangWatch application.
- Use the
curlcommand to get you analytics data. Here is a basic template:
- Execute the
curlcommand. If successful, LangWatch will return the custom analytics data in the response.
Screenshots on how to get the JSON data.
On the right menu button above the graph you will see the Show API menu link. Click that and a modal will then popup.