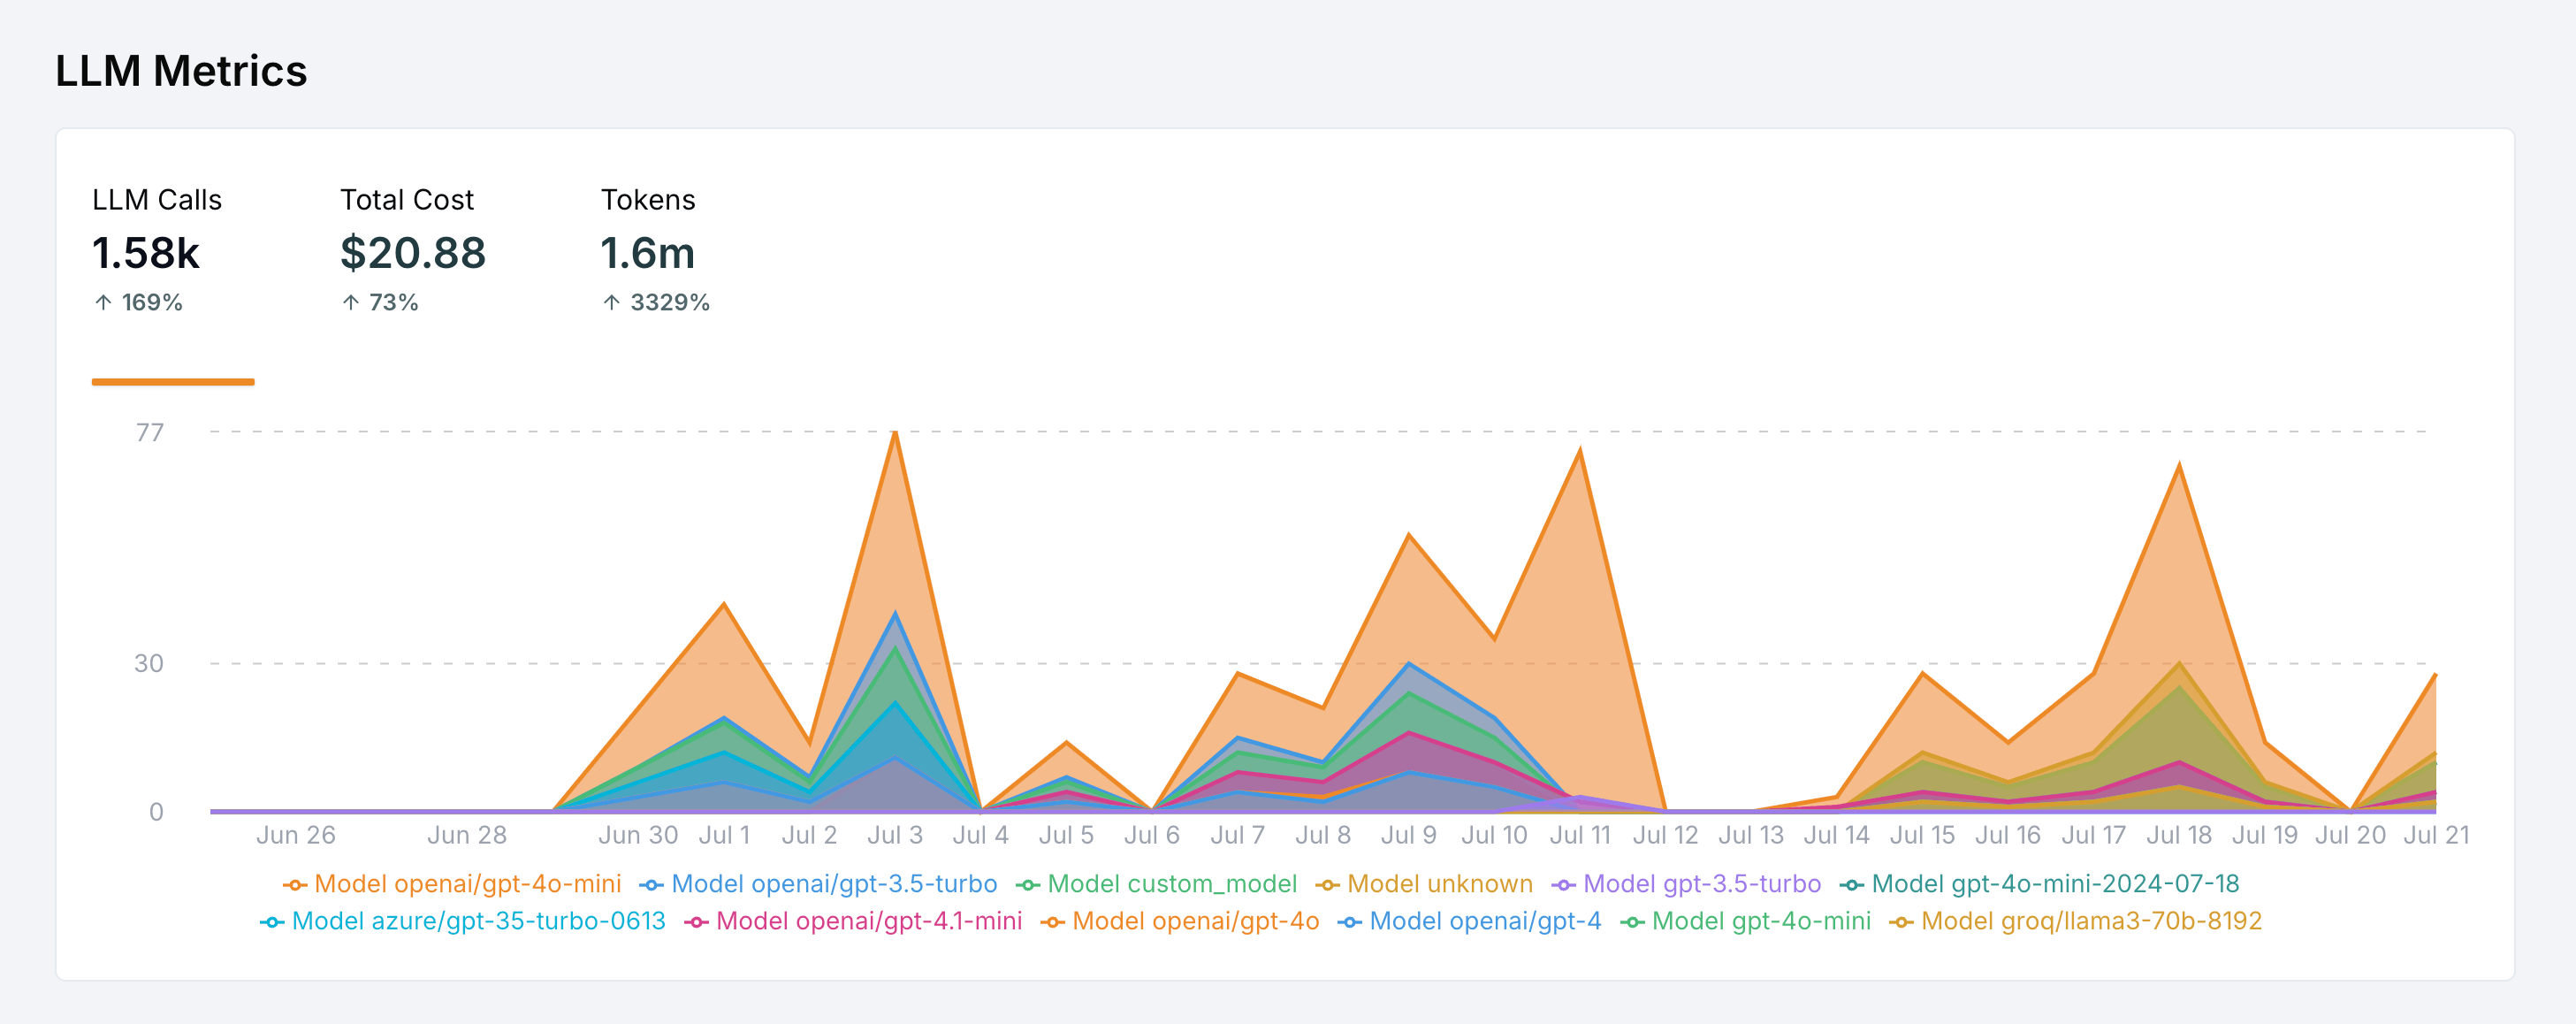
Understanding Cost and Token Tracking
LangWatch calculates costs and tracks tokens by:- Capturing model names in LLM spans to match against cost tables
- Recording token metrics (
prompt_tokens,completion_tokens) in span data, or estimating when not available - Mapping models to costs using the pricing table in Settings > Model Costs
Step 1: Verify LLM Span Data Capture
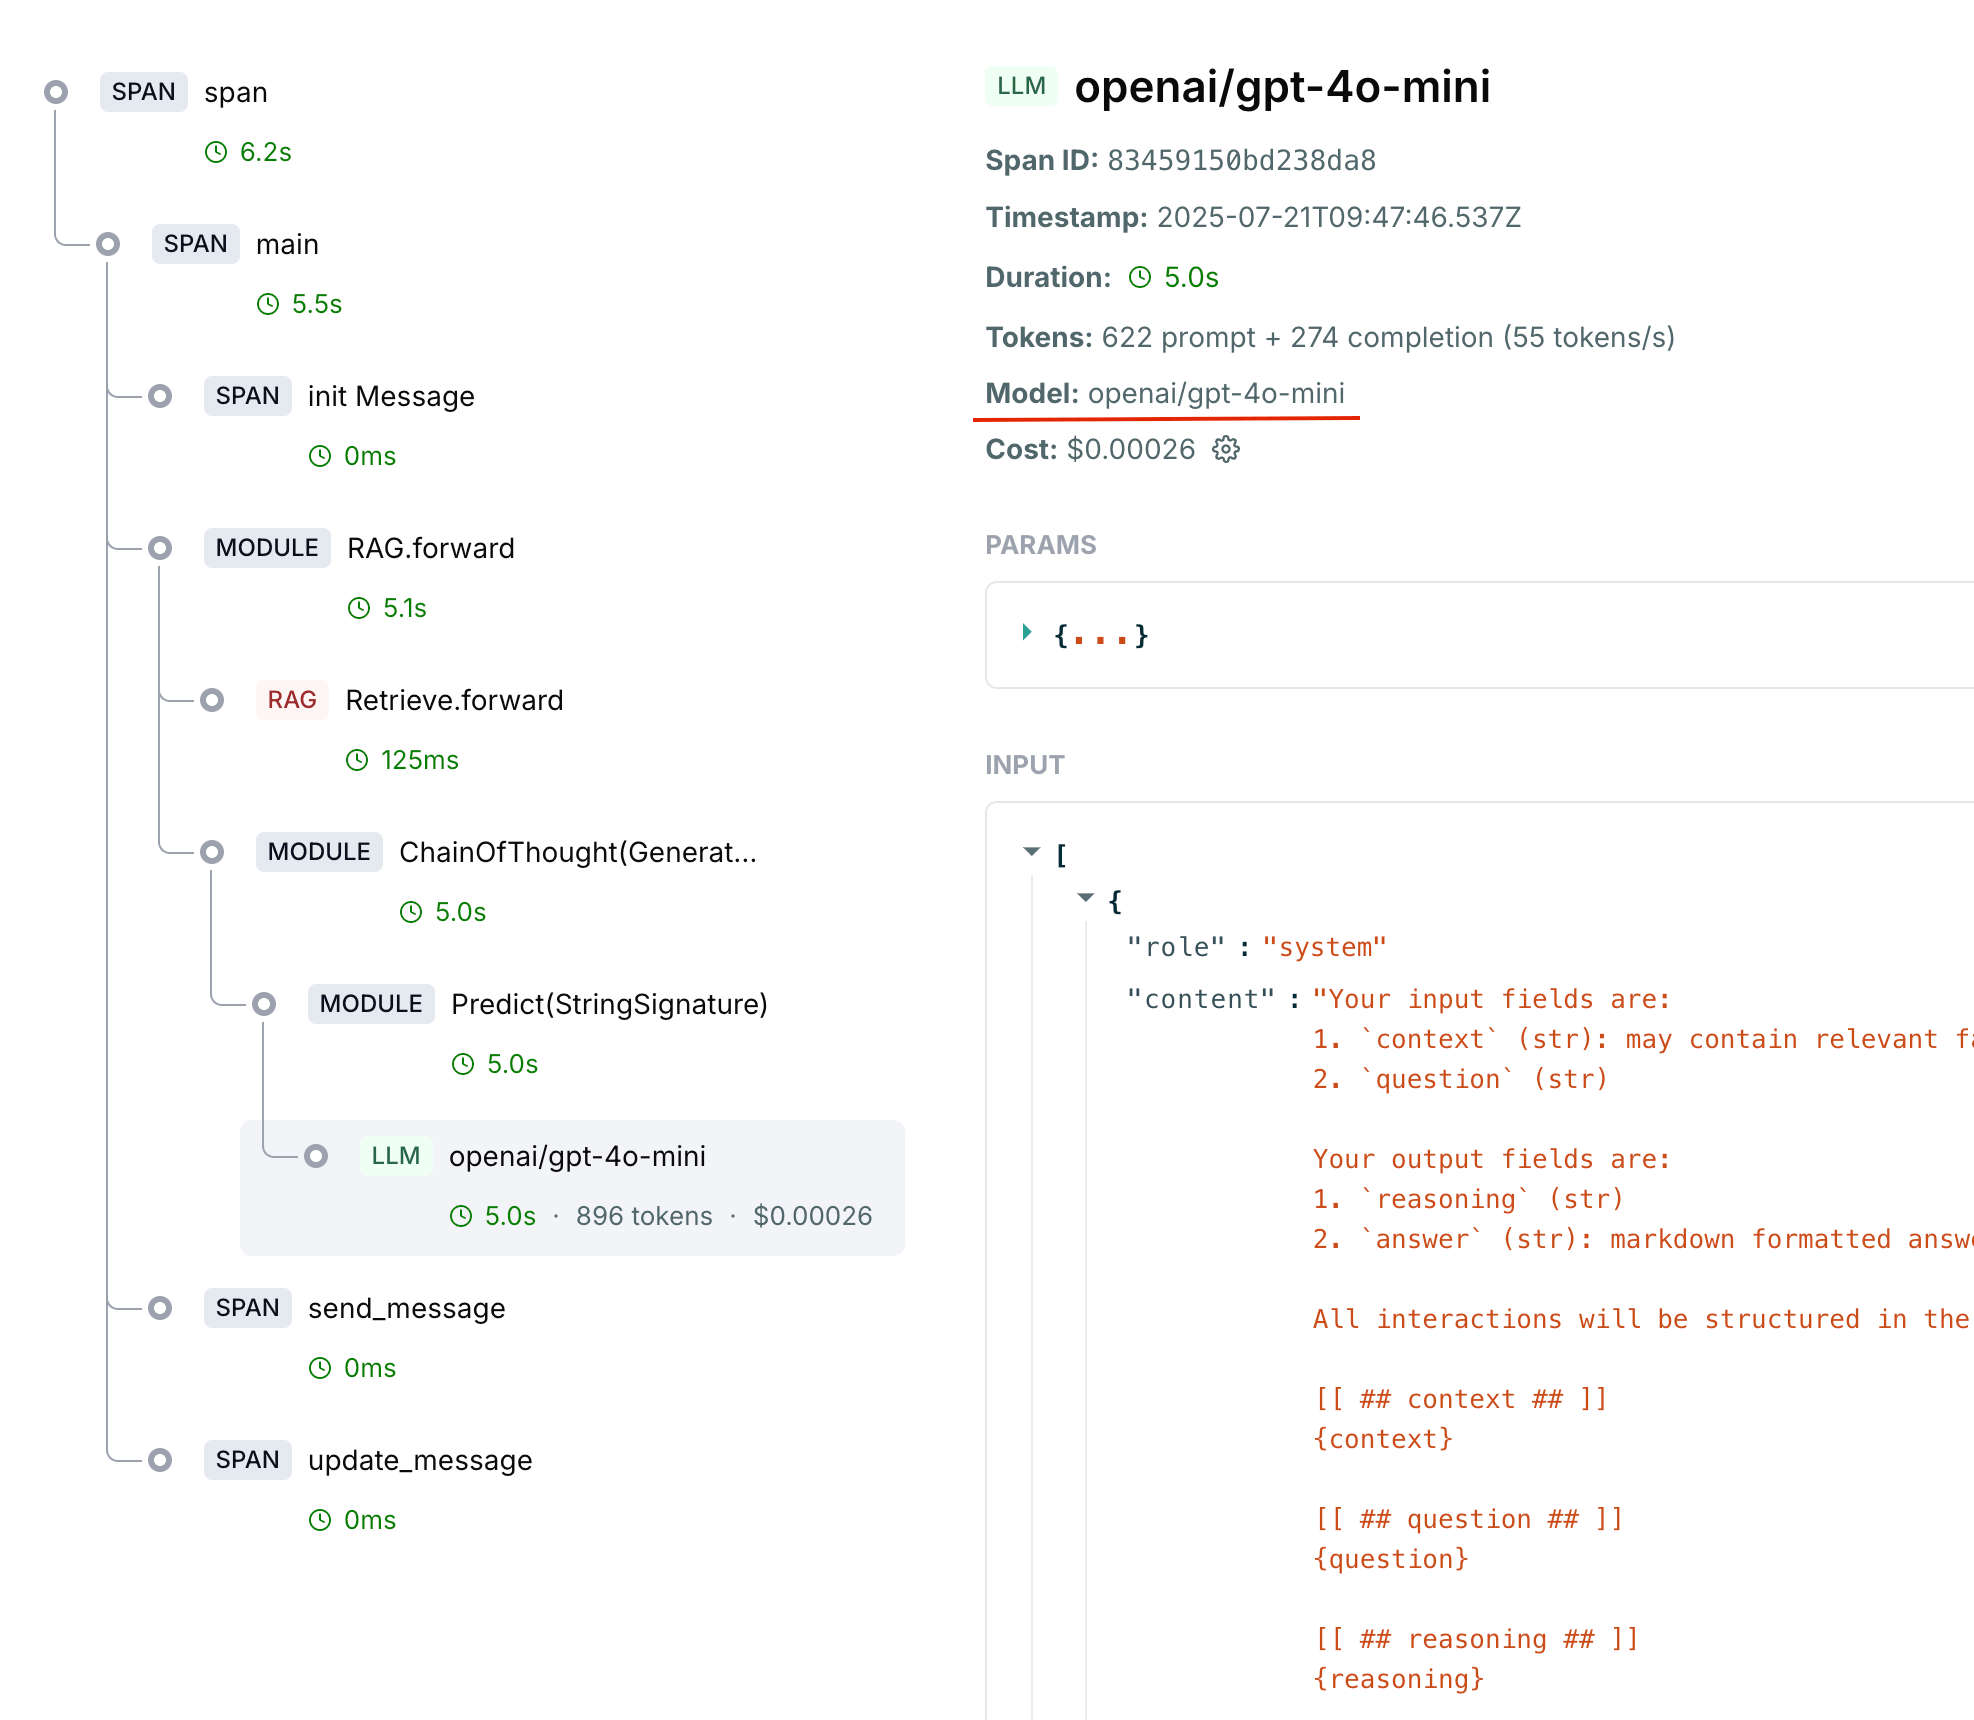
The most common issue is that your LLM spans aren’t capturing the required data: model name, inputs, outputs, and token metrics.Check Your Current Spans
First, examine what data is being captured in your LLM spans. In the LangWatch dashboard:- Navigate to a trace that should have cost/token data
- Click on the LLM span to inspect its details
- Look for these key fields:
- Model: Should show the model identifier (e.g.,
openai/gpt-5) - Input/Output: Should contain the actual messages sent and received
- Metrics: Should show prompt + completion tokens
- Model: Should show the model identifier (e.g.,
Step 2: Fix Missing Model Information
If your spans don’t show model information, the integration framework you’re using might not be capturing it automatically.Solution A: Use Framework Auto-tracking
LangWatch provides auto-tracking for popular frameworks that automatically captures all the necessary data for cost calculation. Check the Integrations menu in the sidebar to find specific setup instructions for your framework, which will show you how to properly configure automatic model and token tracking.Solution B: Manually Set Model Information
If auto-tracking isn’t available for your framework, manually update the span with model information:Solution C: Direct OpenTelemetry Integration (without LangWatch SDK)
If you’re using a framework with built-in OpenTelemetry integration or community instrumentors, they should be following the GenAI Semantic Conventions. However, if the integration isn’t capturing model information or token counts correctly, you can wrap your LLM calls with a custom span to patch the missing data:Step 3: Configure Model Cost Mapping
If your model information is being captured but costs still show $0, you need to configure the cost mapping.Check Existing Model Costs
- Go to Settings > Model Costs in your LangWatch dashboard
- Look for your model in the list
- Check if the regex pattern matches your model identifier
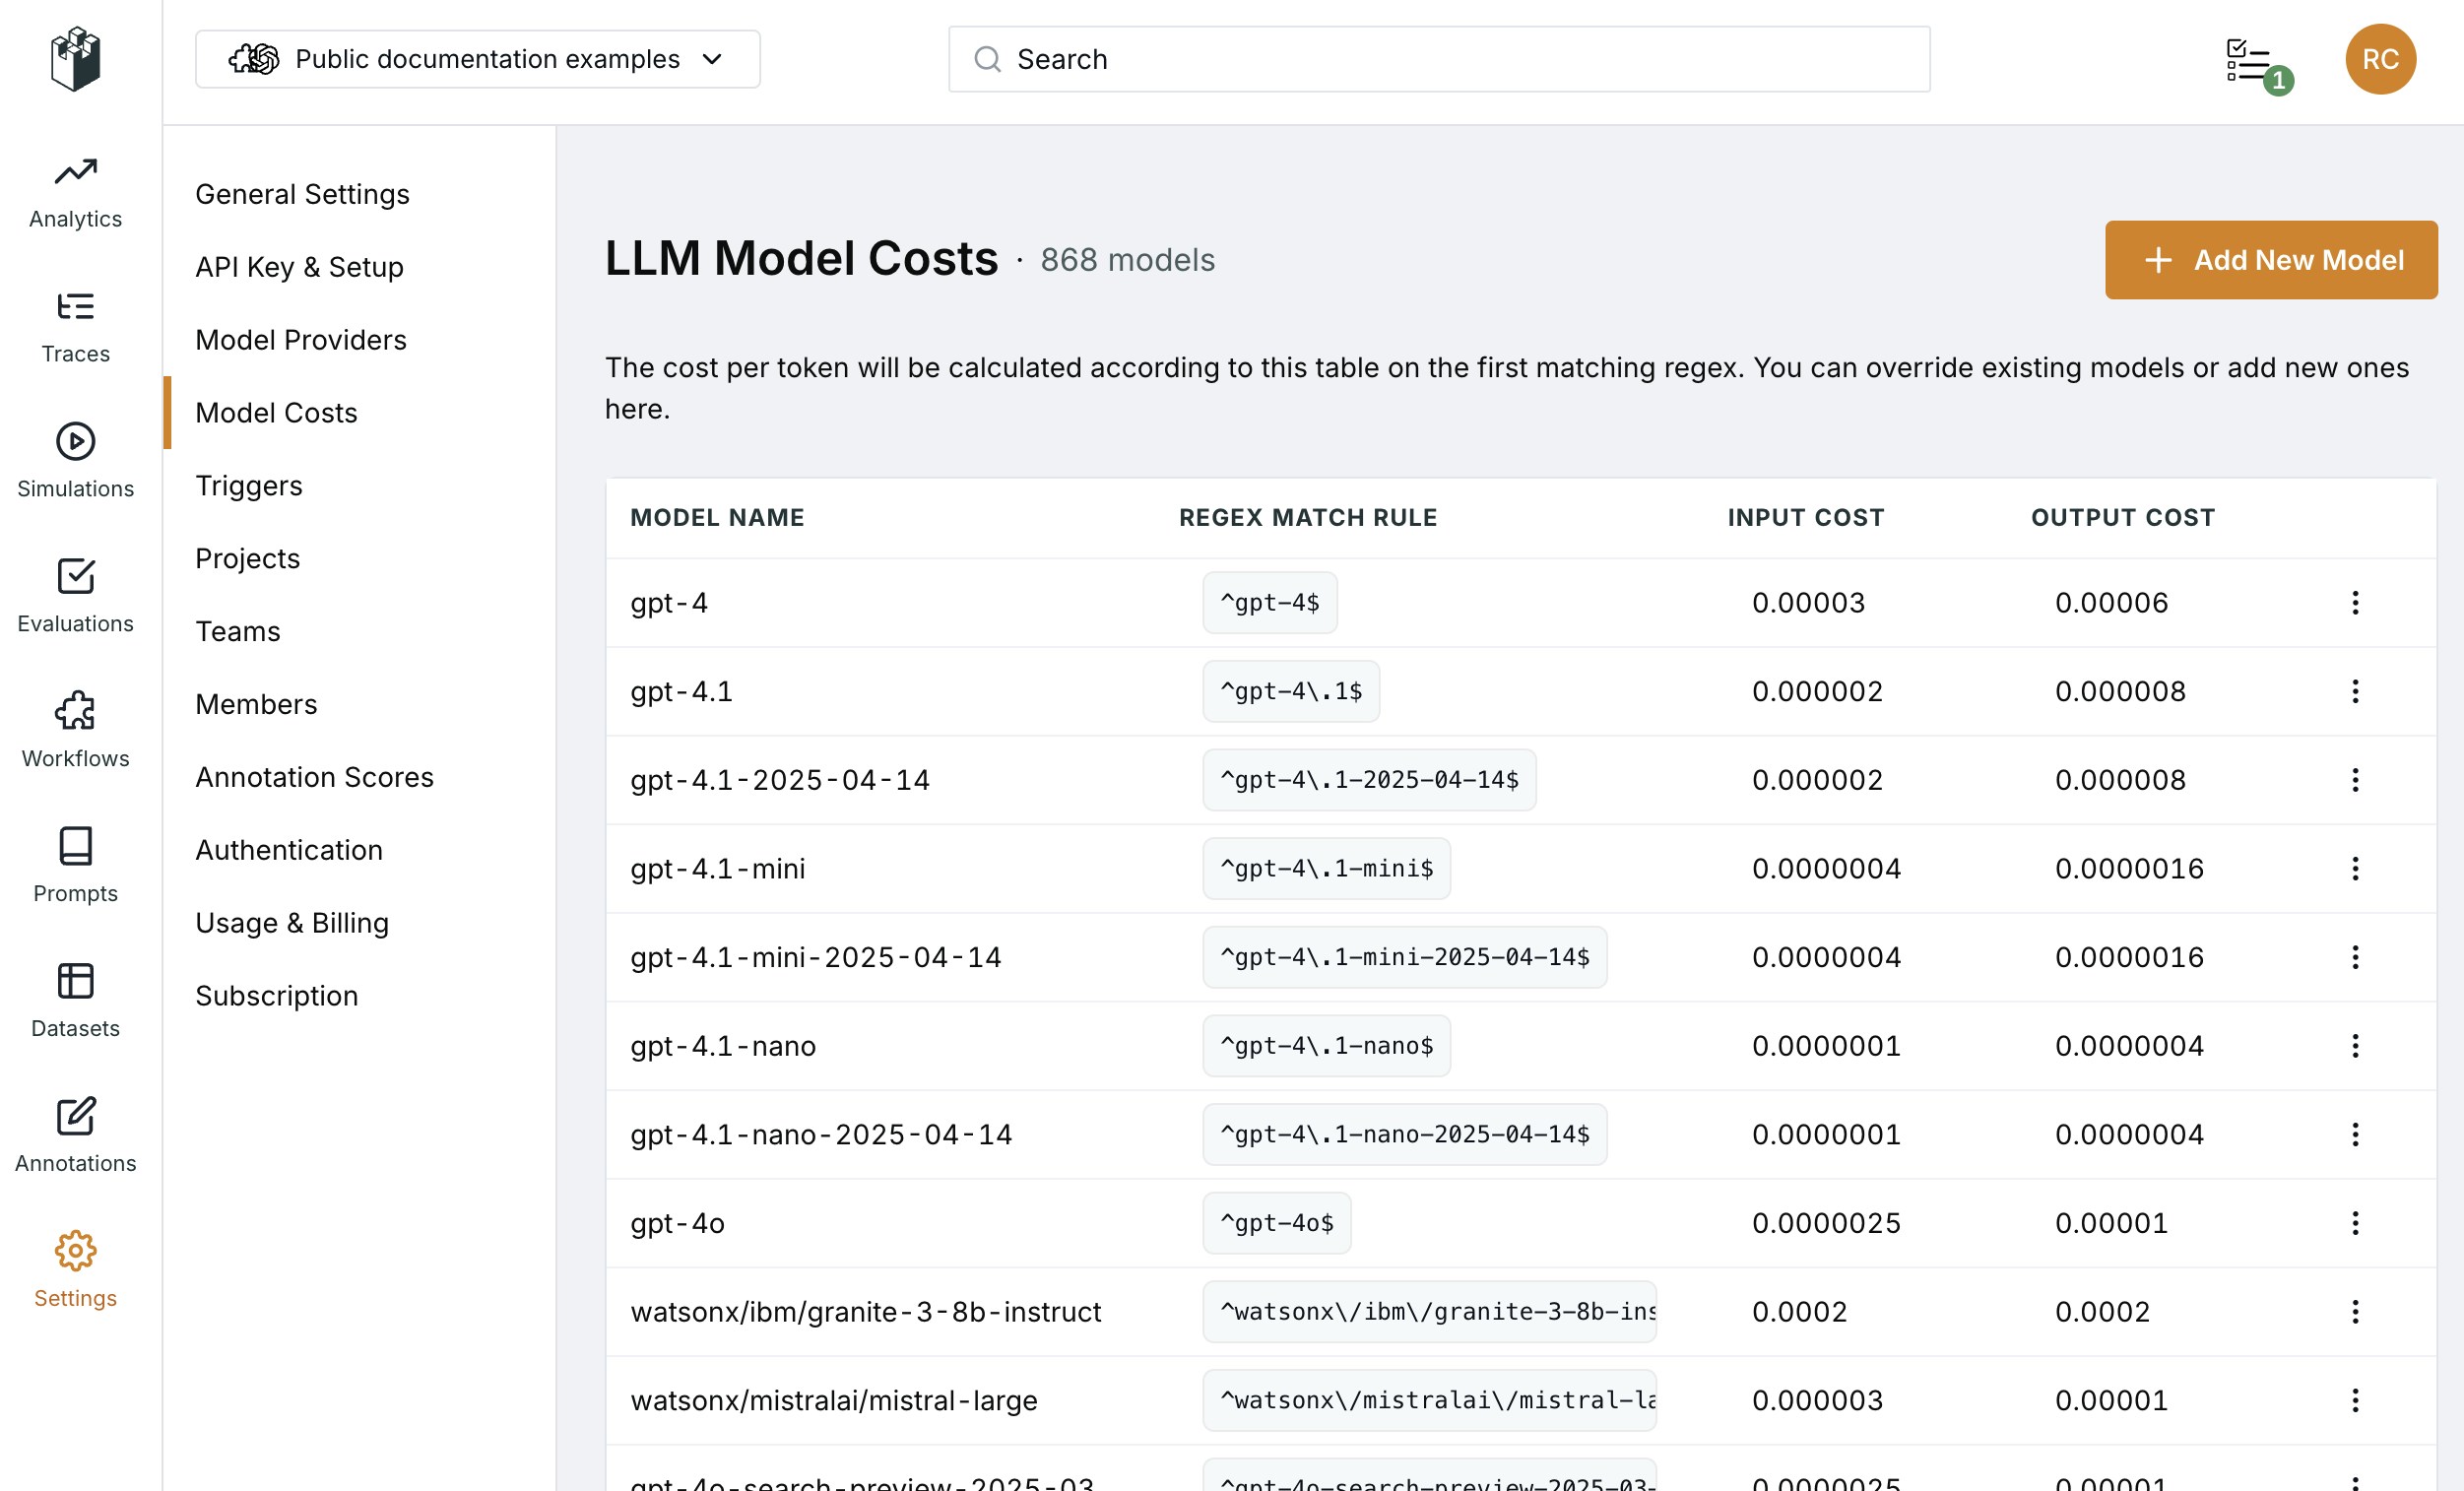
Add Custom Model Costs
If your model isn’t in the cost table, add it:- Click “Add New Model” in Settings > Model Costs
- Configure the model entry:
- Model Name: Descriptive name (e.g., “gpt-5”)
- Regex Match Rule: Pattern to match your model identifier (e.g.,
^gpt-5$) - Input Cost: Cost per input token (e.g.,
0.0000004) - Output Cost: Cost per output token (e.g.,
0.0000016)
Common Model Identifier Patterns
Make sure your regex patterns match how the model names appear in your spans:| Framework | Model Identifier Format | Regex Pattern |
|---|---|---|
| OpenAI SDK | gpt-5 | ^gpt-5$ |
| Azure OpenAI | gpt-5 | ^gpt-5$ |
| LangChain | openai/gpt-5 | ^openai/gpt-5$ |
| Custom | my-custom-model-v1 | ^my-custom-model-v1$ |
Verification Checklist
After running your test, verify in the LangWatch dashboard: ✅ Trace appears in the dashboard✅ LLM span shows model name (e.g.,
gpt-5) ✅ Input and output are captured
✅ Token metrics are present (
prompt_tokens, completion_tokens) ✅ Cost is calculated and displayed (non-zero value)
Common Issues and Solutions
Issue: Auto-tracking not working
Symptoms: Spans appear but without model/metrics data Solutions:- Ensure
autotrack_*()is called on an active trace - Check that the client instance being tracked is the same one making calls
- Verify the integration is initialized correctly
Issue: Custom models not calculating costs
Symptoms: Model name appears but cost remains $0 Solutions:- Check regex pattern in Model Costs settings
- Ensure the pattern exactly matches your model identifier
- Verify input and output costs are configured correctly
Issue: Token counts are 0 but model is captured
Symptoms: Model name is present but token metrics are missing Solutions:- Manually set metrics in span updates if not automatically captured
- Check if your LLM provider returns usage information
- Ensure the integration is extracting token counts from responses
Issue: Framework with OpenTelemetry not capturing model data
Symptoms: Using a framework with OpenTelemetry integration that’s not capturing model names or token counts Solutions:- Follow the guidance in Solution C: Framework with OpenTelemetry Integration above
- Wrap your LLM calls with custom spans to patch missing data
Getting Help
If you’re still experiencing issues after following this guide:- Check the LangWatch logs for any error messages
- Verify your API key and endpoint configuration
- Share a minimal reproduction with the specific framework you’re using
- Contact support at [email protected] with:
- Your integration method (SDK, OpenTelemetry, etc.)
- Framework versions
- Sample span data from the dashboard