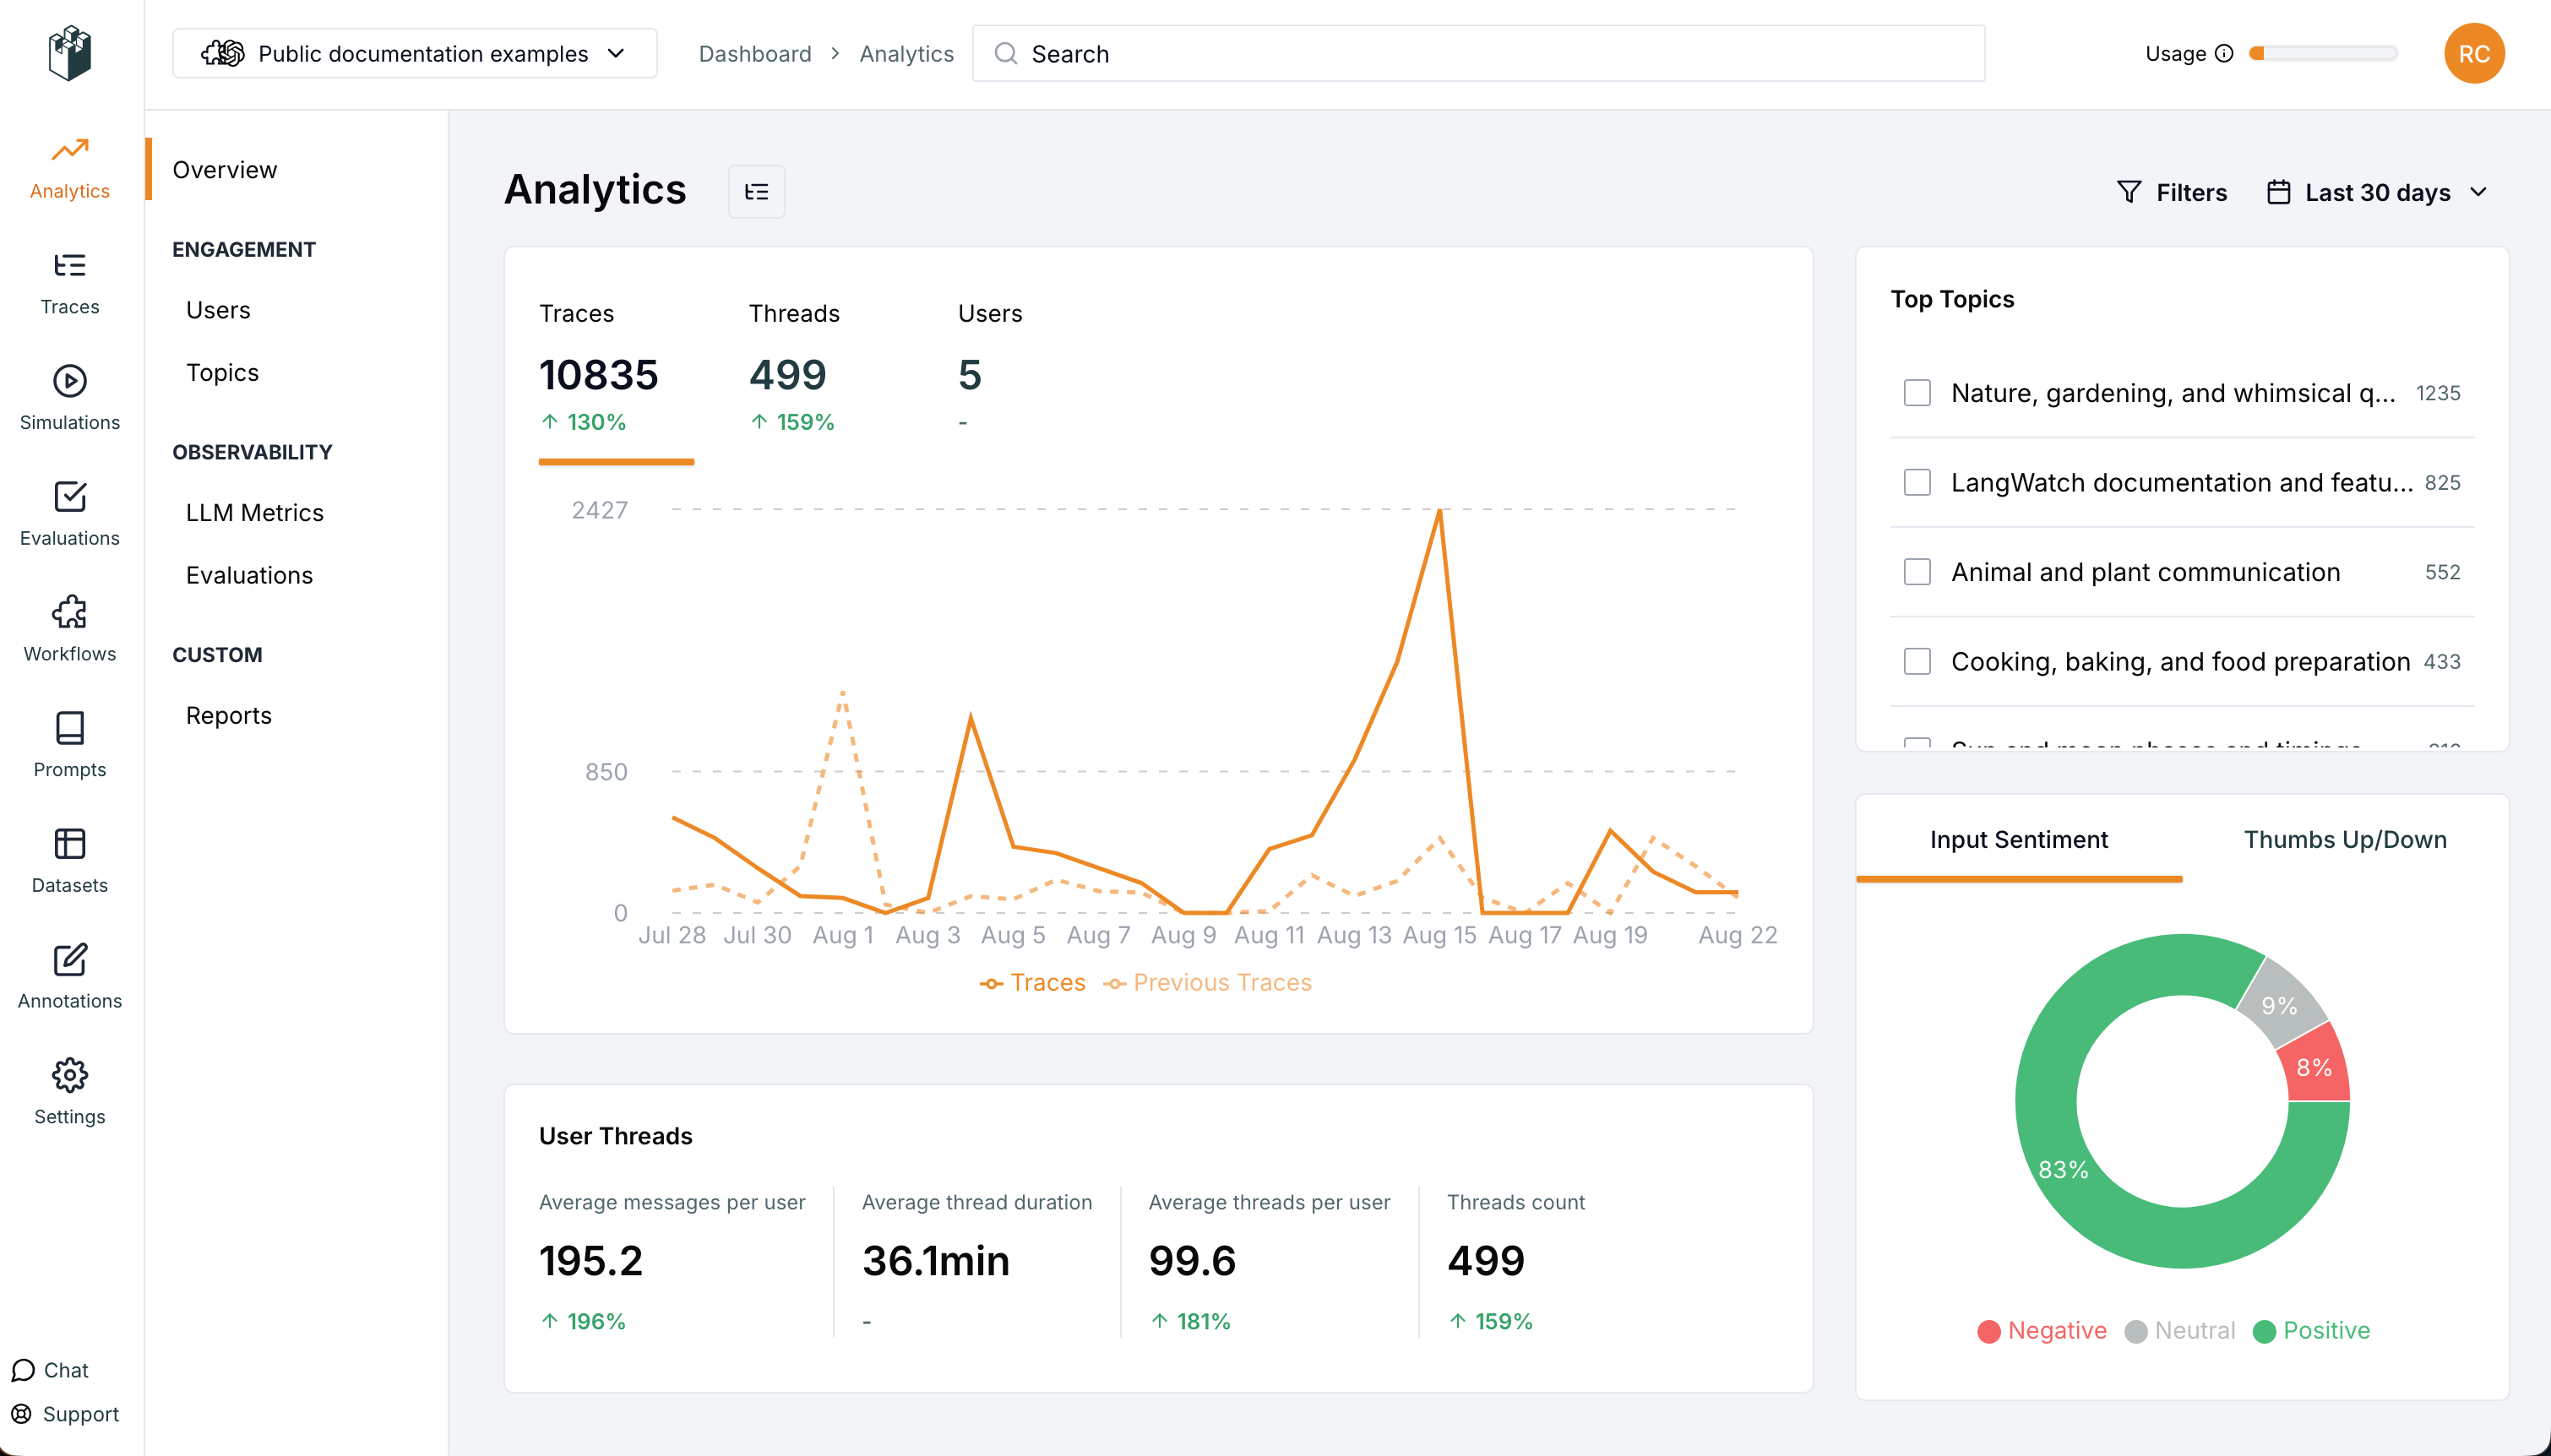
LangWatch home page
Search...
⌘K
llms.txt
Support
Dashboard
langwatch/langwatch
langwatch/langwatch
Search...
Navigation
Features
Analytics
Documentation
Open Dashboard
GitHub Repo
Get Started
Introduction
Self Hosting
Integrations
Cookbooks
Agent Simulations
Introduction to Agent Testing
Overview
Getting Started
Simulation Sets
Batch Runs
Individual Run View
LLM Observability
Overview
Concepts
Quick Start
SDKs
Tutorials
User Events
Monitoring & Alerts
Code Examples
LLM Evaluation
Overview
Evaluation Tracking API
Evaluation Wizard
Real-Time Evaluation
Built-in Evaluators
Datasets
Annotations
Prompt Management
Overview
Get Started
Data Model
Scope
Prompts CLI
Features
Version Control
Analytics
GitHub Integration
Link to Traces
Using Prompts in the Optimization Studio
Guaranteed Availability
A/B Testing
LLM Development
Prompt Optimization Studio
DSPy Visualization
LangWatch MCP
API Endpoints
Traces
Prompts
Annotations
Datasets
Triggers
Scenarios
Use Cases
Evaluating a RAG Chatbot for Technical Manuals
Evaluating an AI Coach with LLM-as-a-Judge
Evaluating Structured Data Extraction
Support
Troubleshooting and Support
Status Page
On this page
Overview Metrics
LLM Metrics
Version Tracking
Evaluations Metrics
Custom Graphs
Features
Analytics
Copy page
Monitor prompt performance and usage with comprehensive analytics
Copy page
LangWatch provides analytics to help you understand how your prompts are performing in production.
Overview Metrics
Track key usage statistics:
Traces
: Total number of prompt executions
Threads
: Number of conversation threads
Users
: Number of unique users
LLM Metrics
Monitor your AI model usage:
LLM Calls
: Number of API calls made
Total Cost
: Cost of all API calls
Tokens
: Total tokens consumed
Version Tracking
Track prompt behavior by version, compare different versions
Filter messages, plot usage, cost, conversion on different prompts
Evaluations Metrics
Run real-time evaluations on the traces to measure prompt performance
Use real-time evaluators for classification of prompt outputs
Custom Graphs
Create custom bar, line, pie, scatter, and more charts with any captured metrics
Compare different prompts and versions
← Back to Prompt Management Overview
Was this page helpful?
Yes
No
Version Control
GitHub Integration
Assistant
Responses are generated using AI and may contain mistakes.